Proxima – Tactical Benchmarks
Ideation through business services; Refinement of Systems and processes

Overview
Company
Project Timeline
Role
Visit
Intro
About Proxima

Proxima is a growth marketing SaaS platform that helps brands refine audience targeting, optimize creative strategies, and gain actionable performance insights.
The platform launched with AI Audiences, a machine learning product that analyzes data from thousands of brands to identify high-performing segments and campaign strategies. This allows marketers to improve targeting and ad performance on Meta and Shopify.
Background
In 2024, Proxima raised Series A funding on the success of AI Audiences. However, the self-service product missed growth targets, and revenue from service contracts remained unstable due to Meta’s unpredictable ad market.
To scale sustainably, we needed to shift to a product-led model by expanding insights features and onboarding new brands to improve targeting precision with fresh customer data.
Problem Statement
Marketers struggle to understand the broader context behind their targeting and creative performance. While analytics tools measure KPIs, they often lack actionable insights for data-driven decisions.
Proposition
A novel benchmarking tool offering multi-angle performance analysis could be highly valuable. Understanding not just the “what,” but the “why” behind performance could redefine marketing decisions and engagement with benchmarks.
Successfully onboarding new brands into Proxima’s ecosystem would also enhance AI Audiences’ targeting accuracy.
My Role & Responsibilities
Executed end-to-end design, from discovery to QA, under direction of design director
Led UI and design system decisions, including a major system update and new data visualization
Collaborated with stakeholders, PMs, engineers, and data analysts
Conducted user research and testing to validate design decisions
Our Goals
Our primary goal was to develop the first of Proxima’s insights tools to increase user engagement and grow customer & brand data.
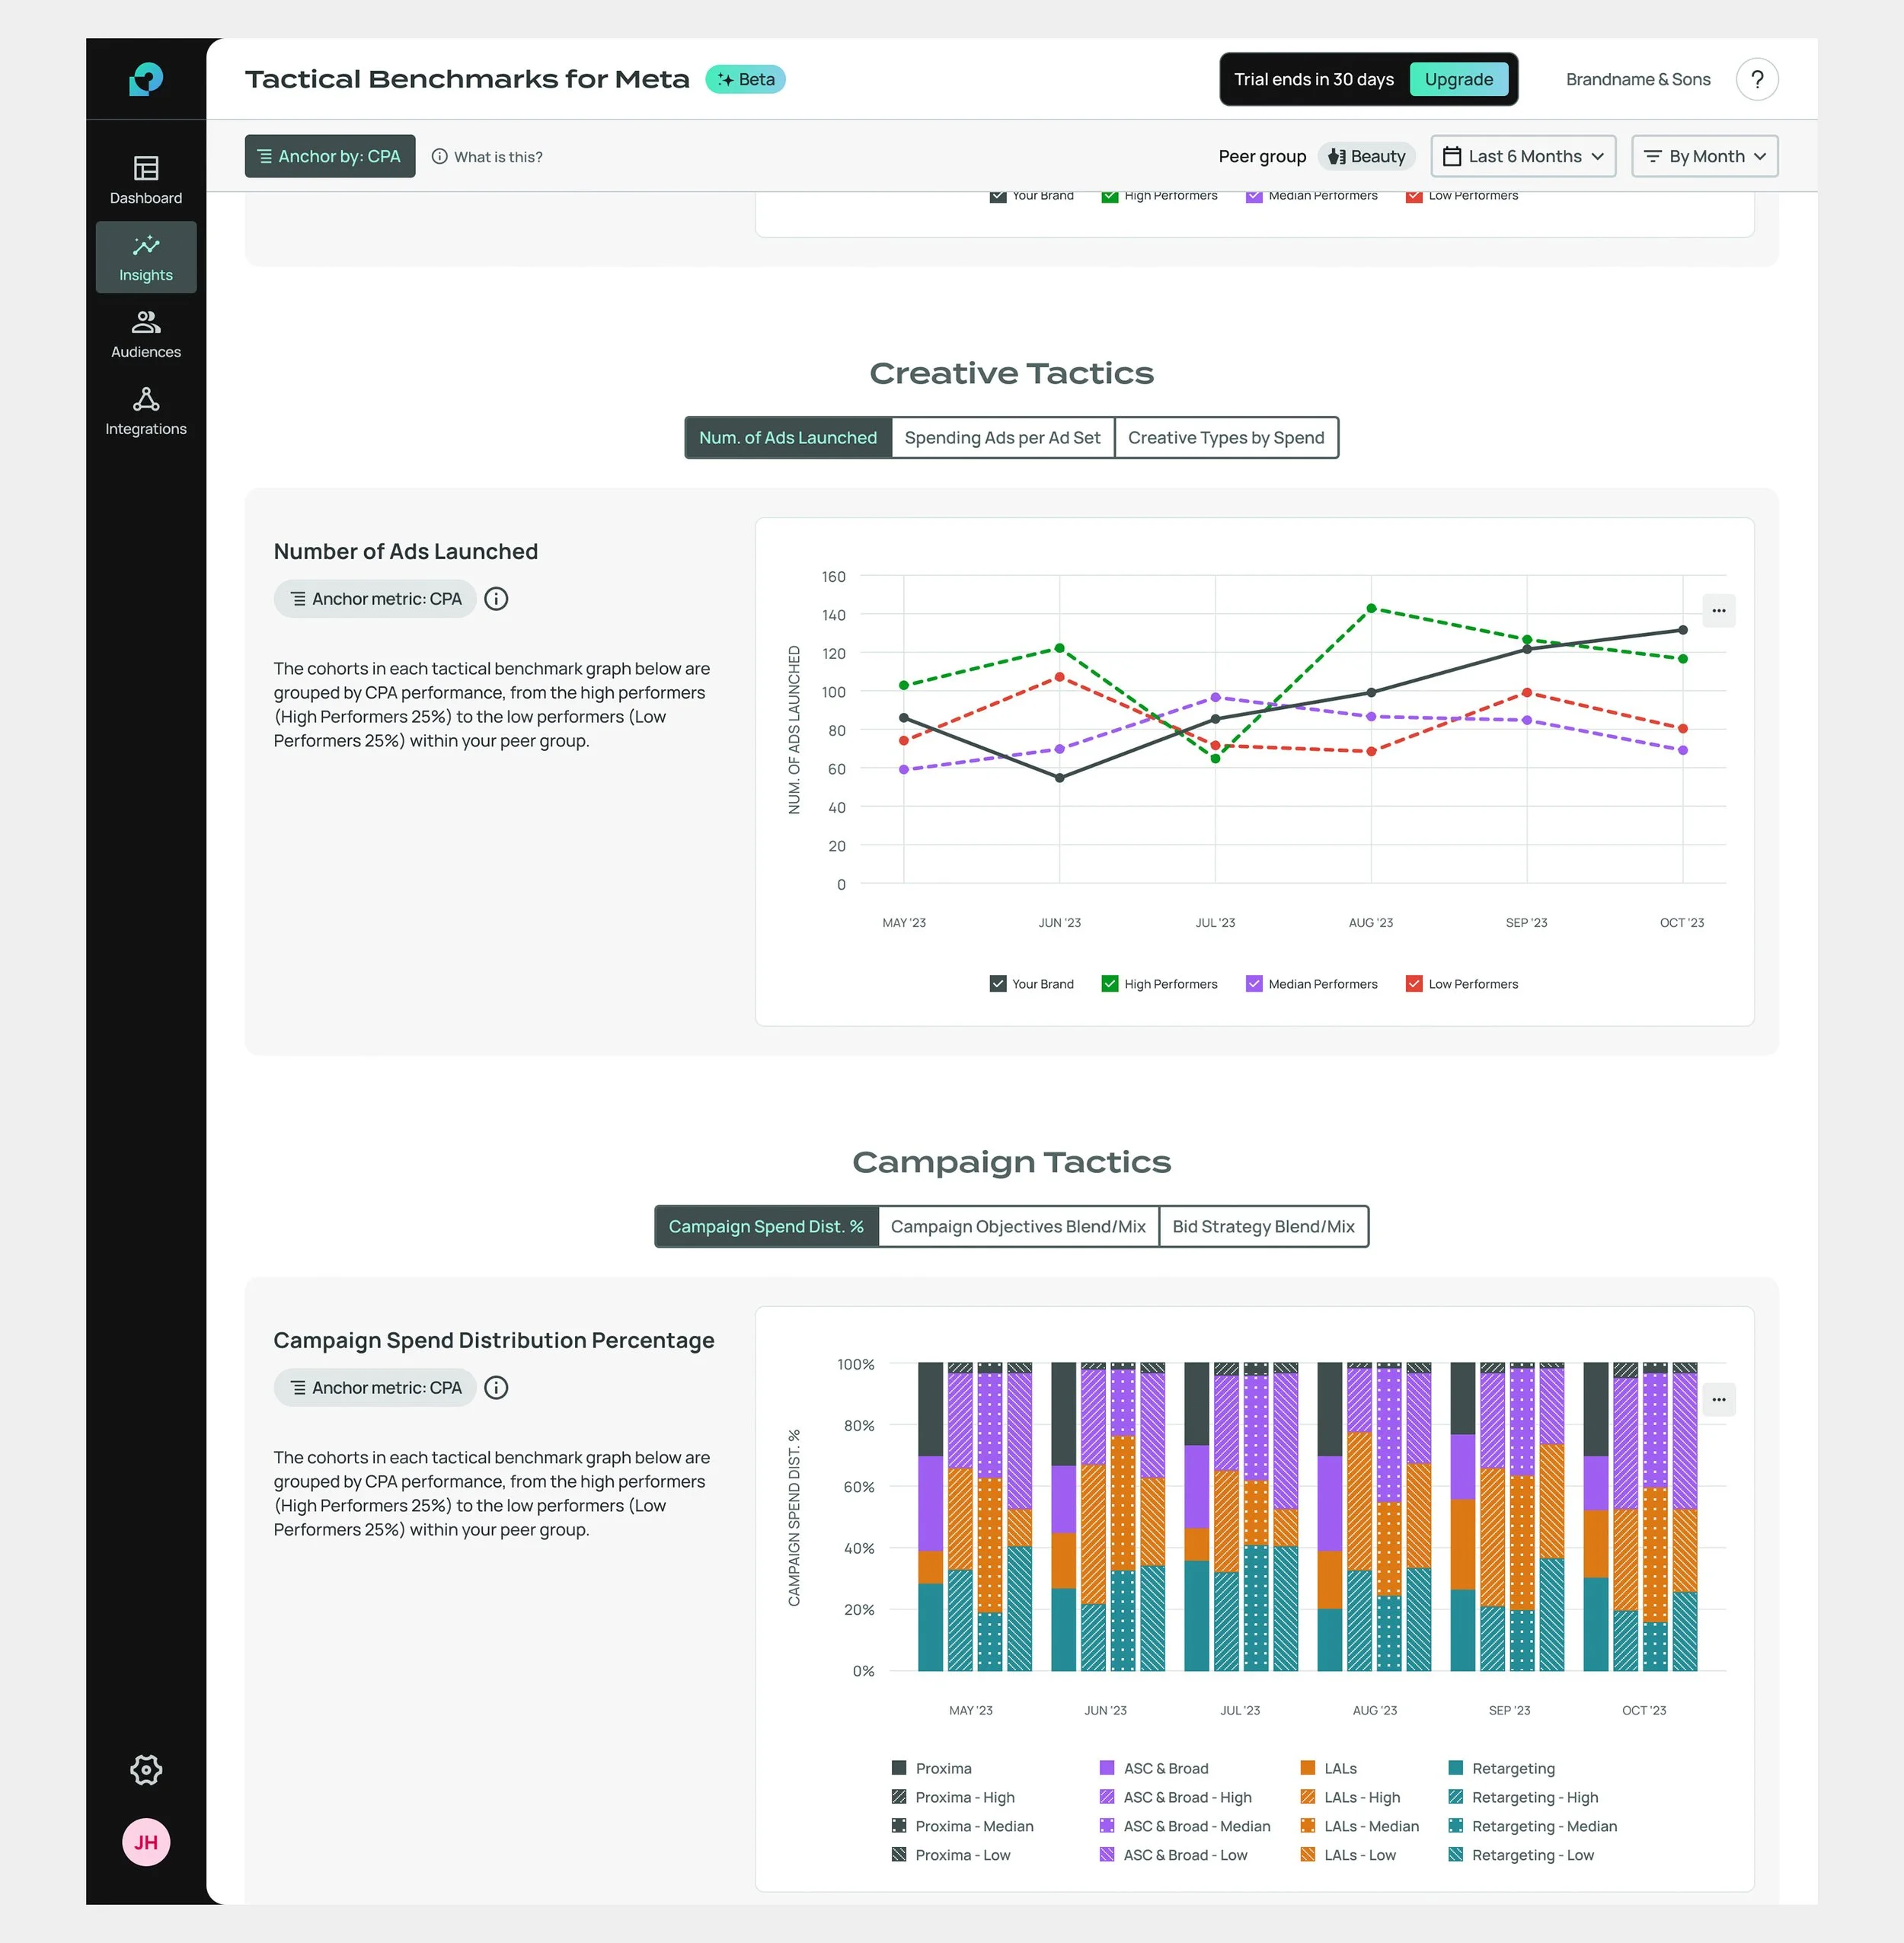
Phase one included Tactical Benchmarks alongside a traditional benchmarking tool. We also aimed to transition to a new design system, update the UI’s visual design, and establish a scalable data visualization system for future insights features.
From Service to Software
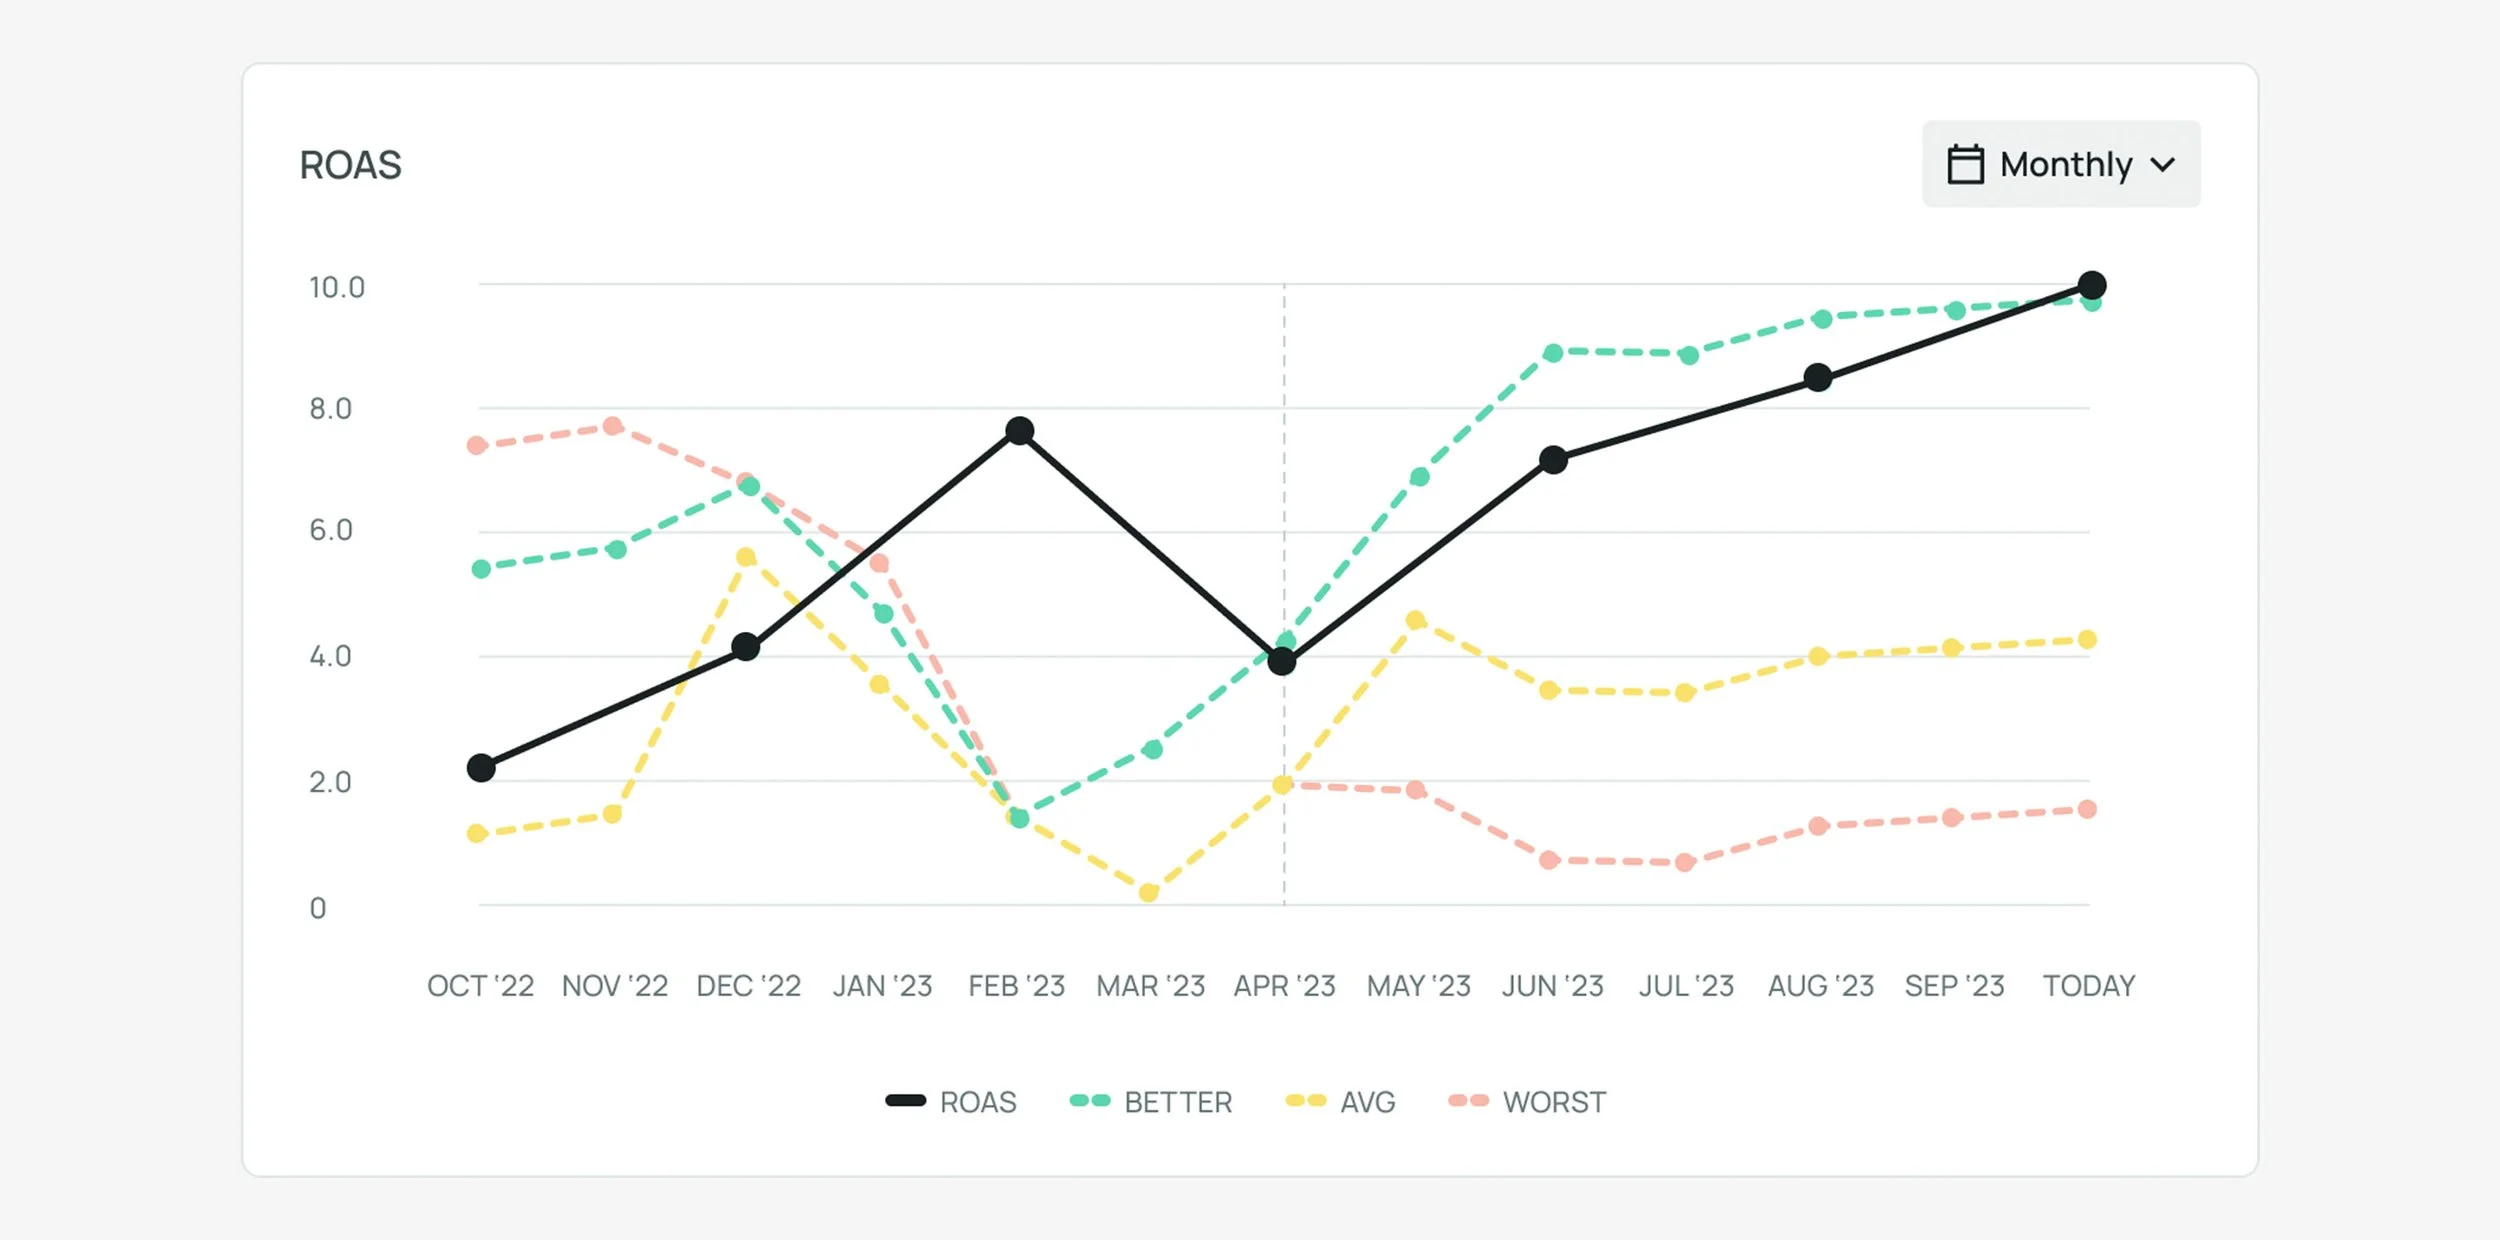
Through our managed AI Audiences service, we uncovered a powerful insight—our unique approach to performance benchmarking consistently resonated with clients. This signaled an opportunity to turn it into a software feature.

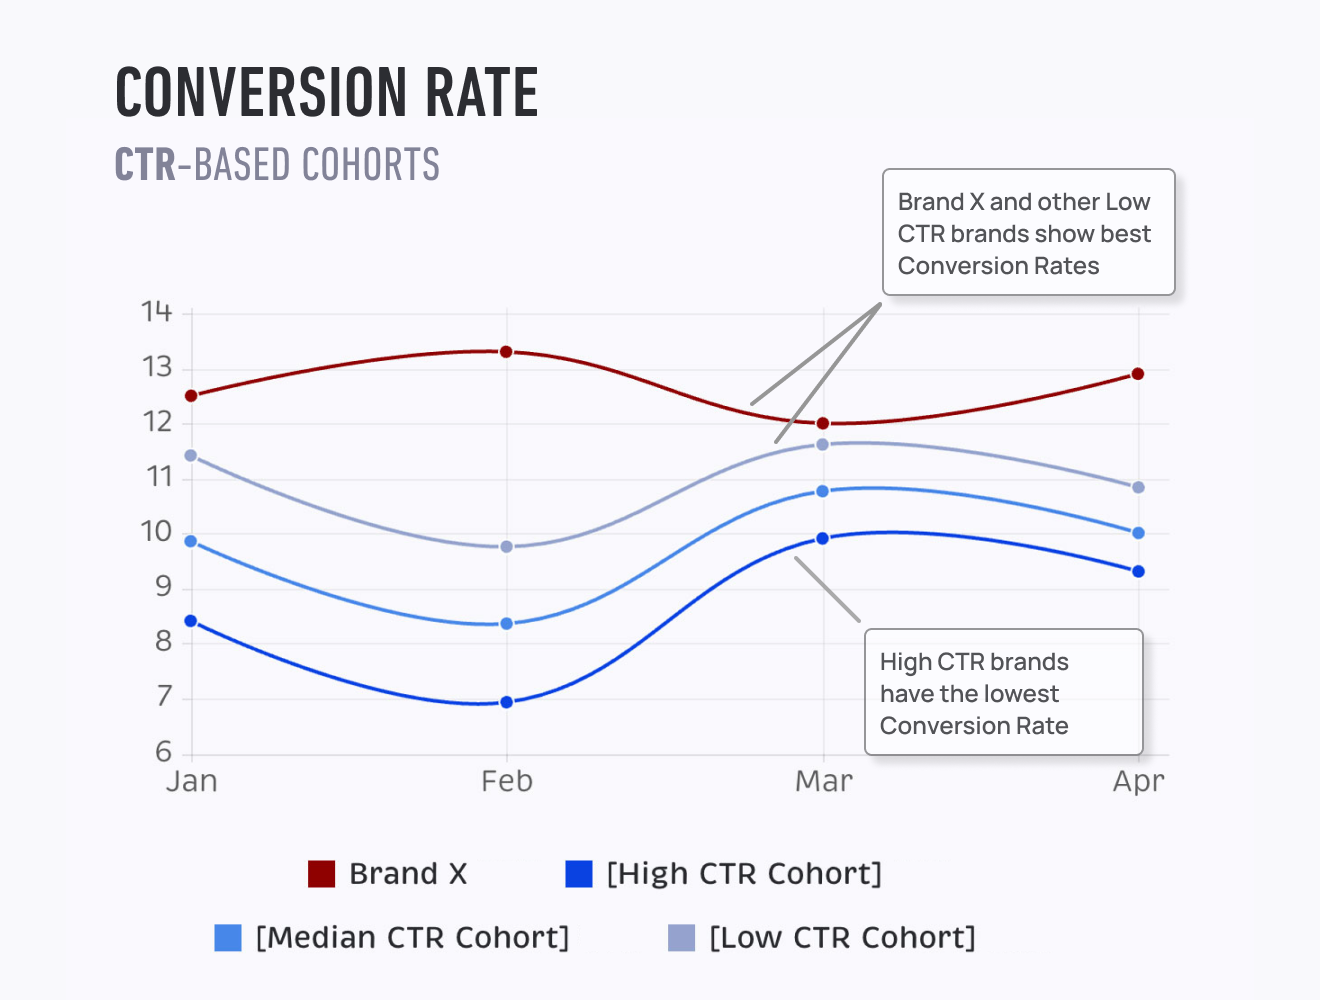
Benchmarking chart from a Proxima client presentation.
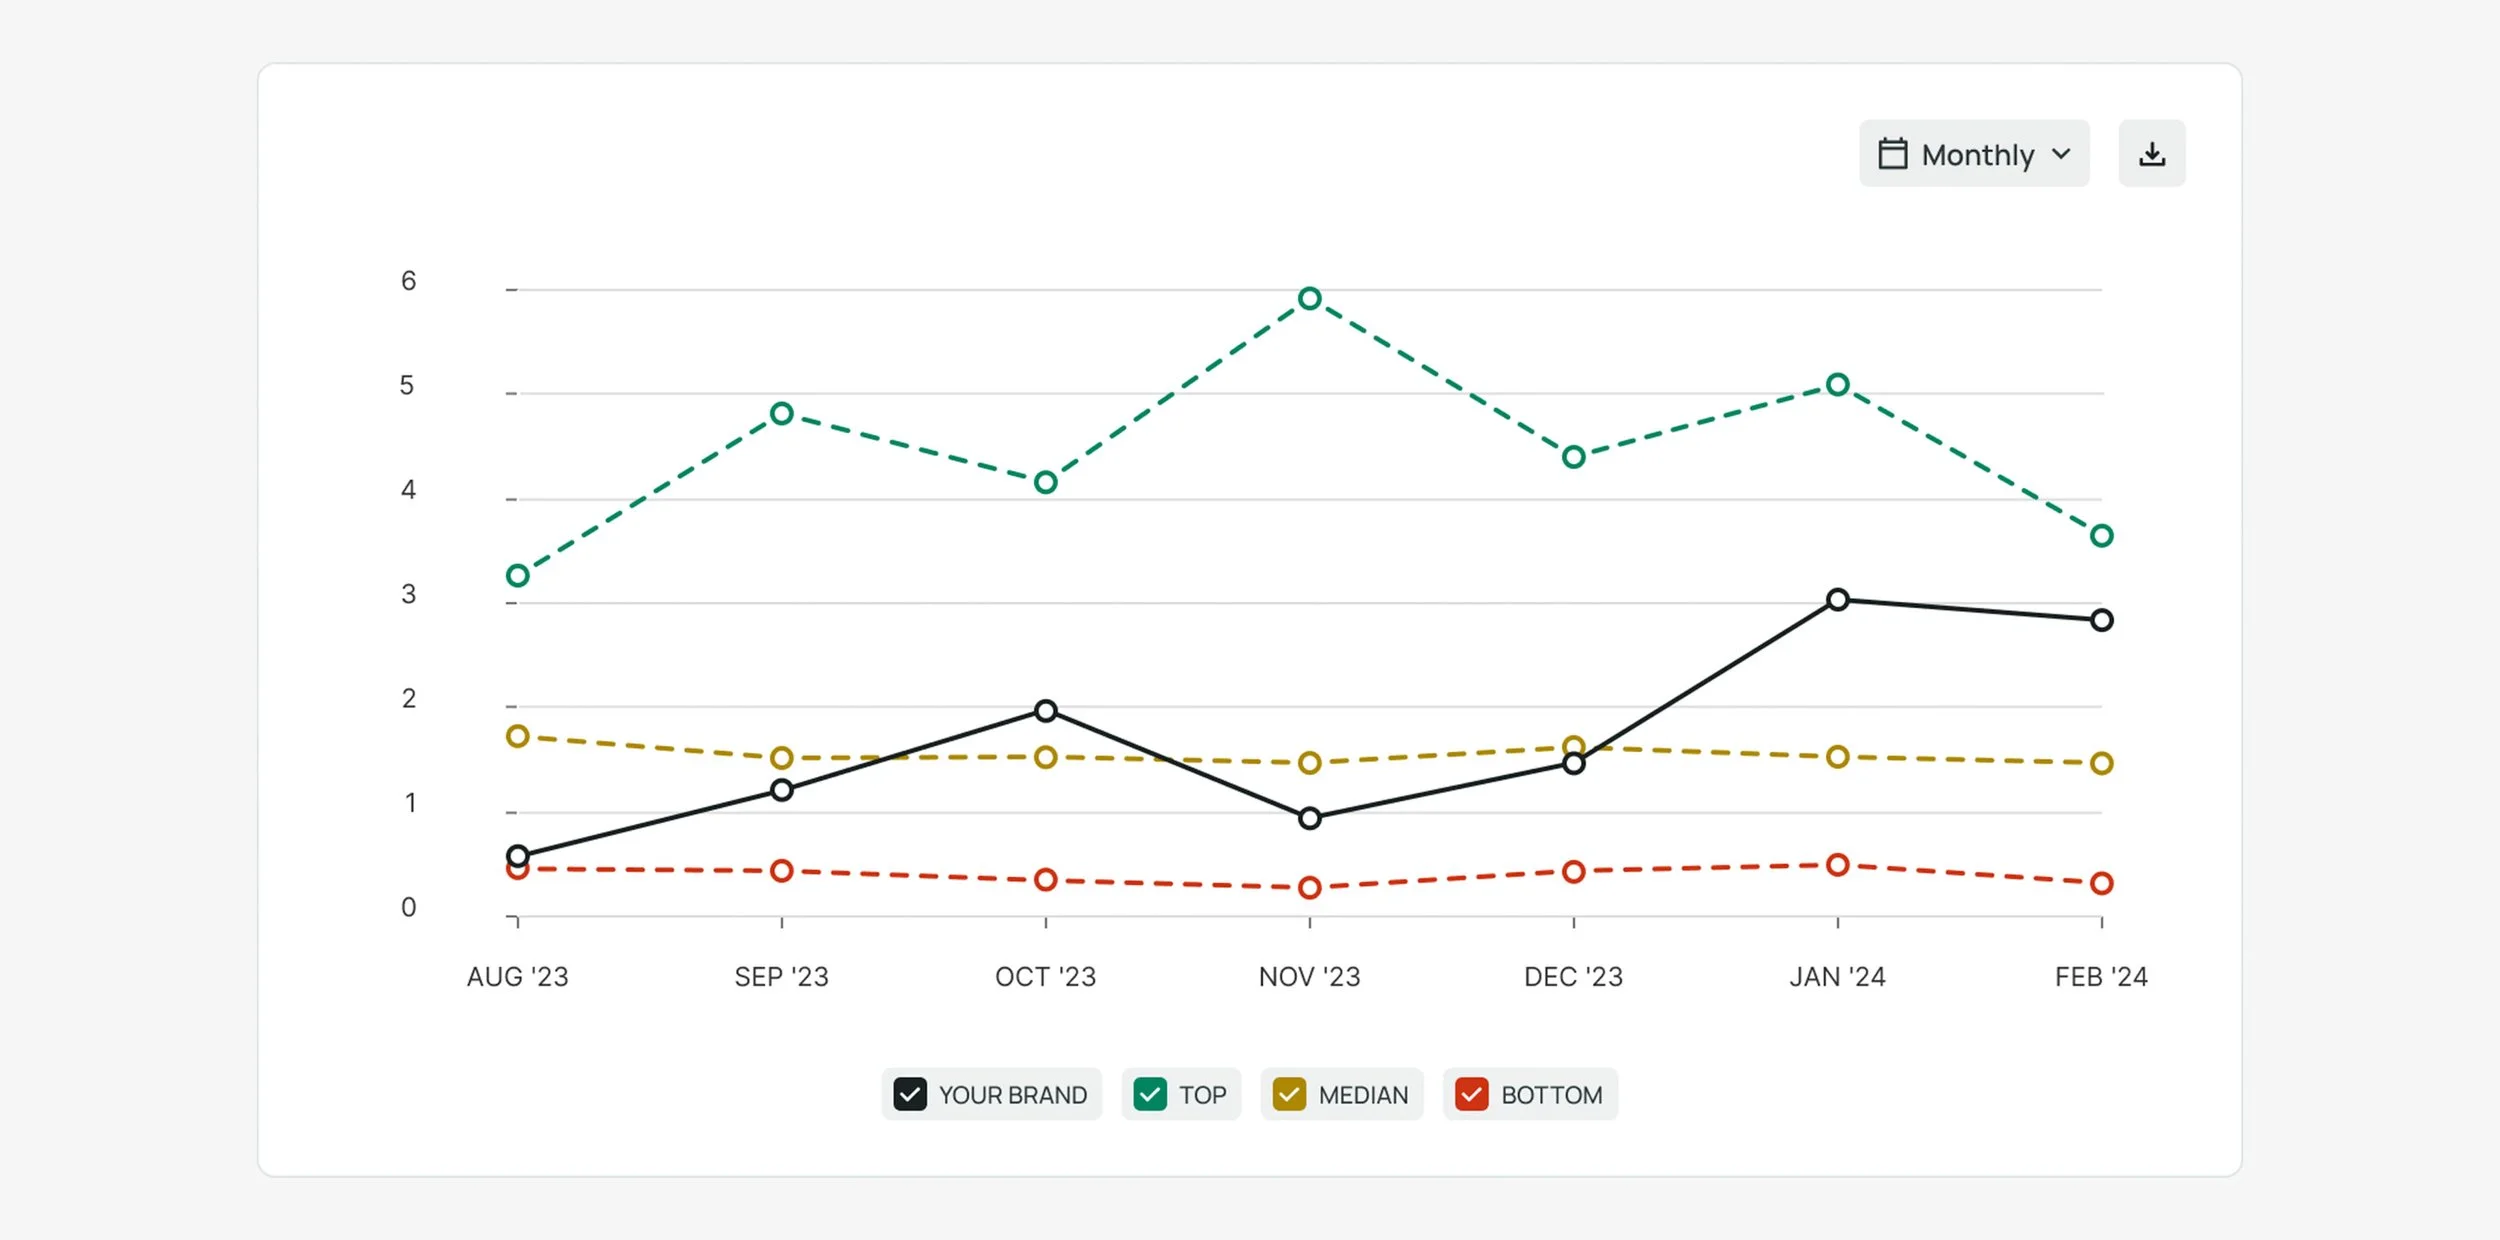
The Limits of Traditional Benchmarking
Most benchmarking tools compare single metrics—like Return on Ad Spend—against industry averages. But looking at one metric in isolation often misses the bigger picture.
A table-formatted benchmarking tool monitoring multiple metrics, from competitor Varos.
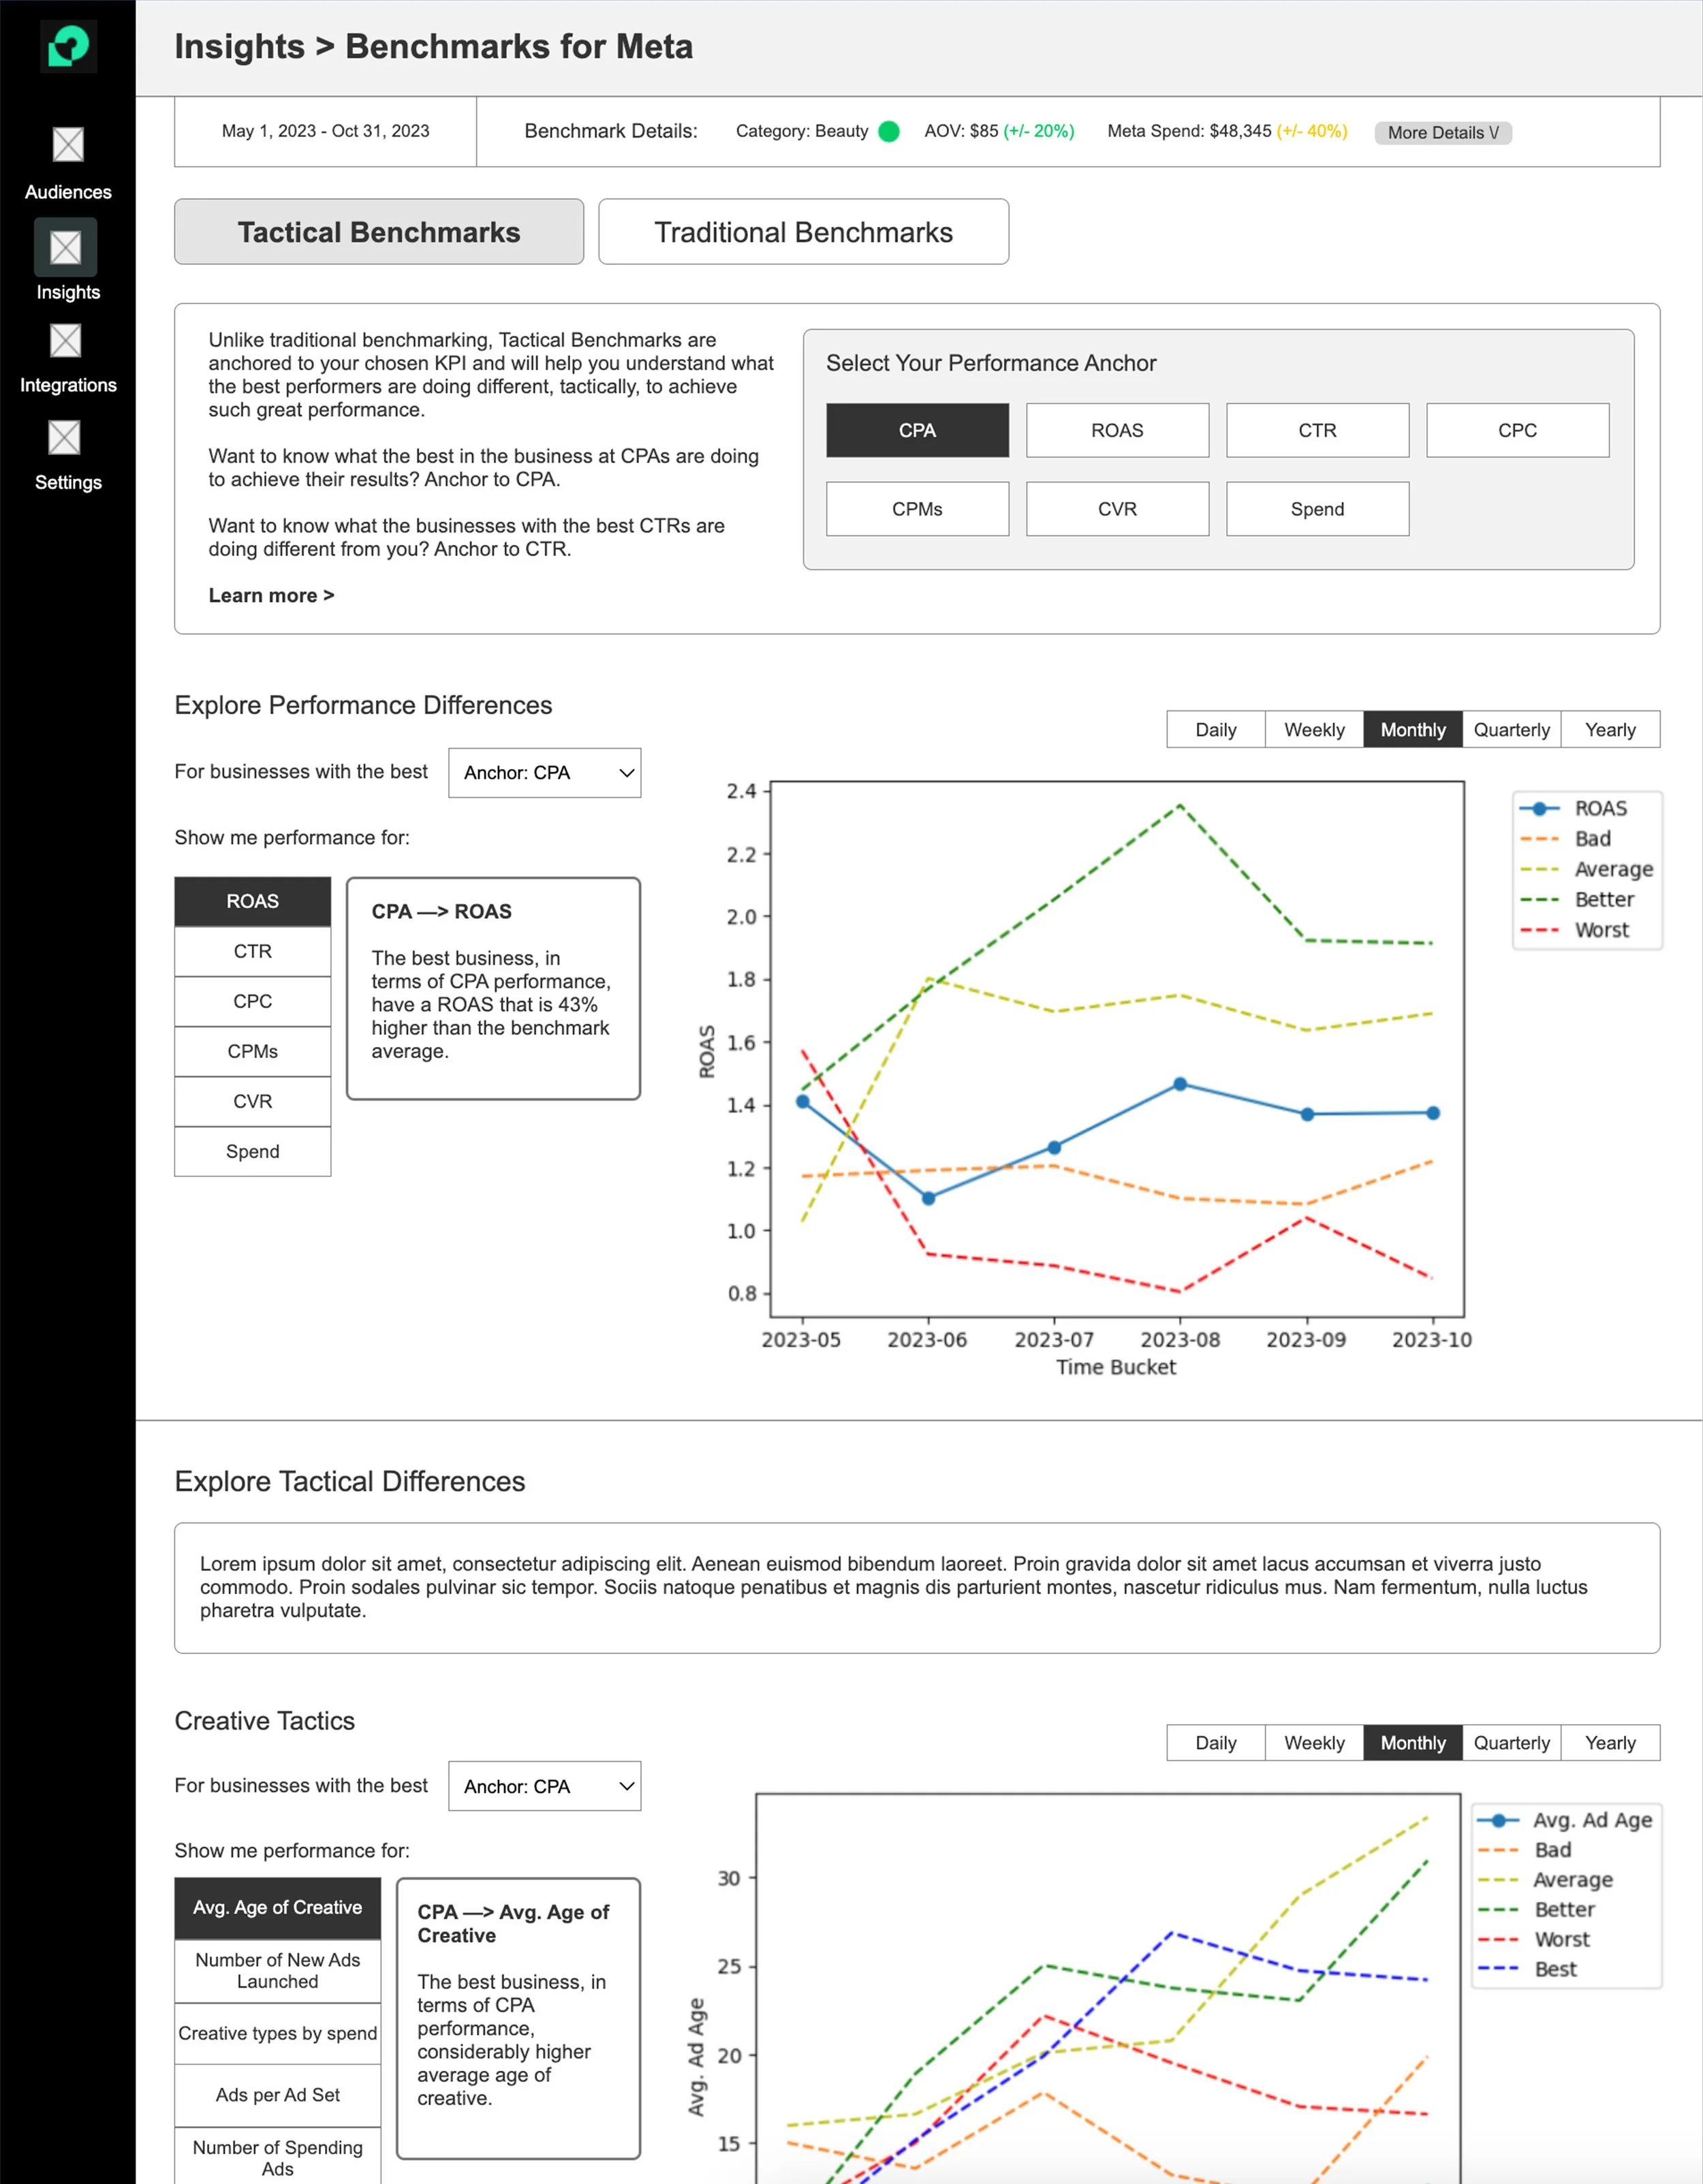
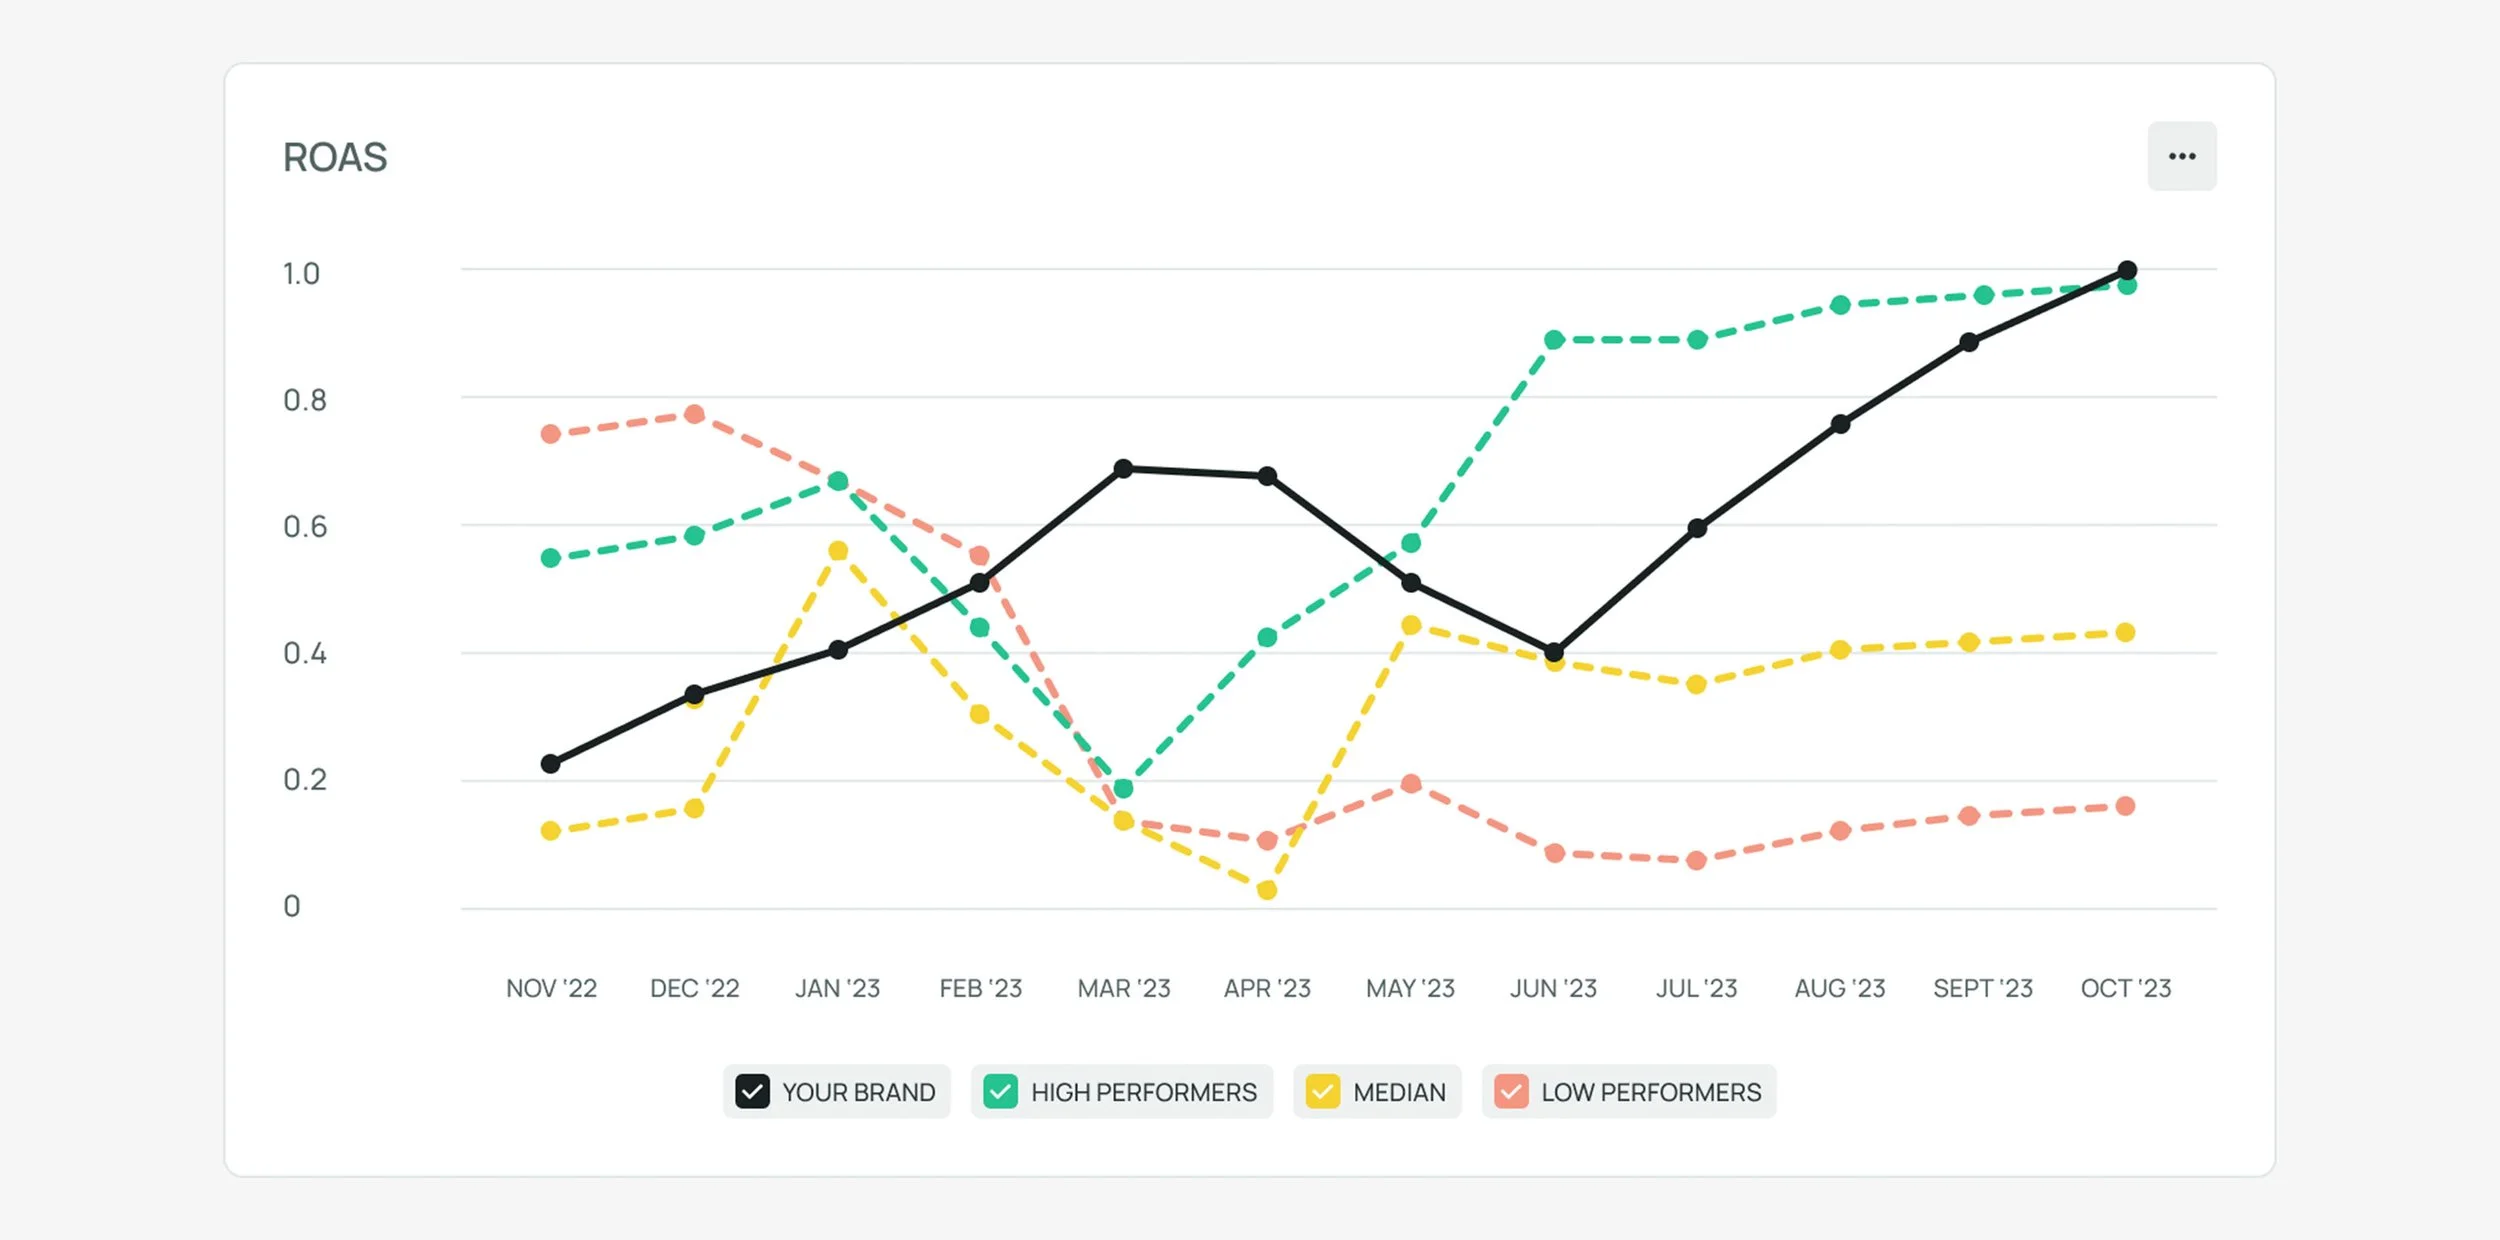
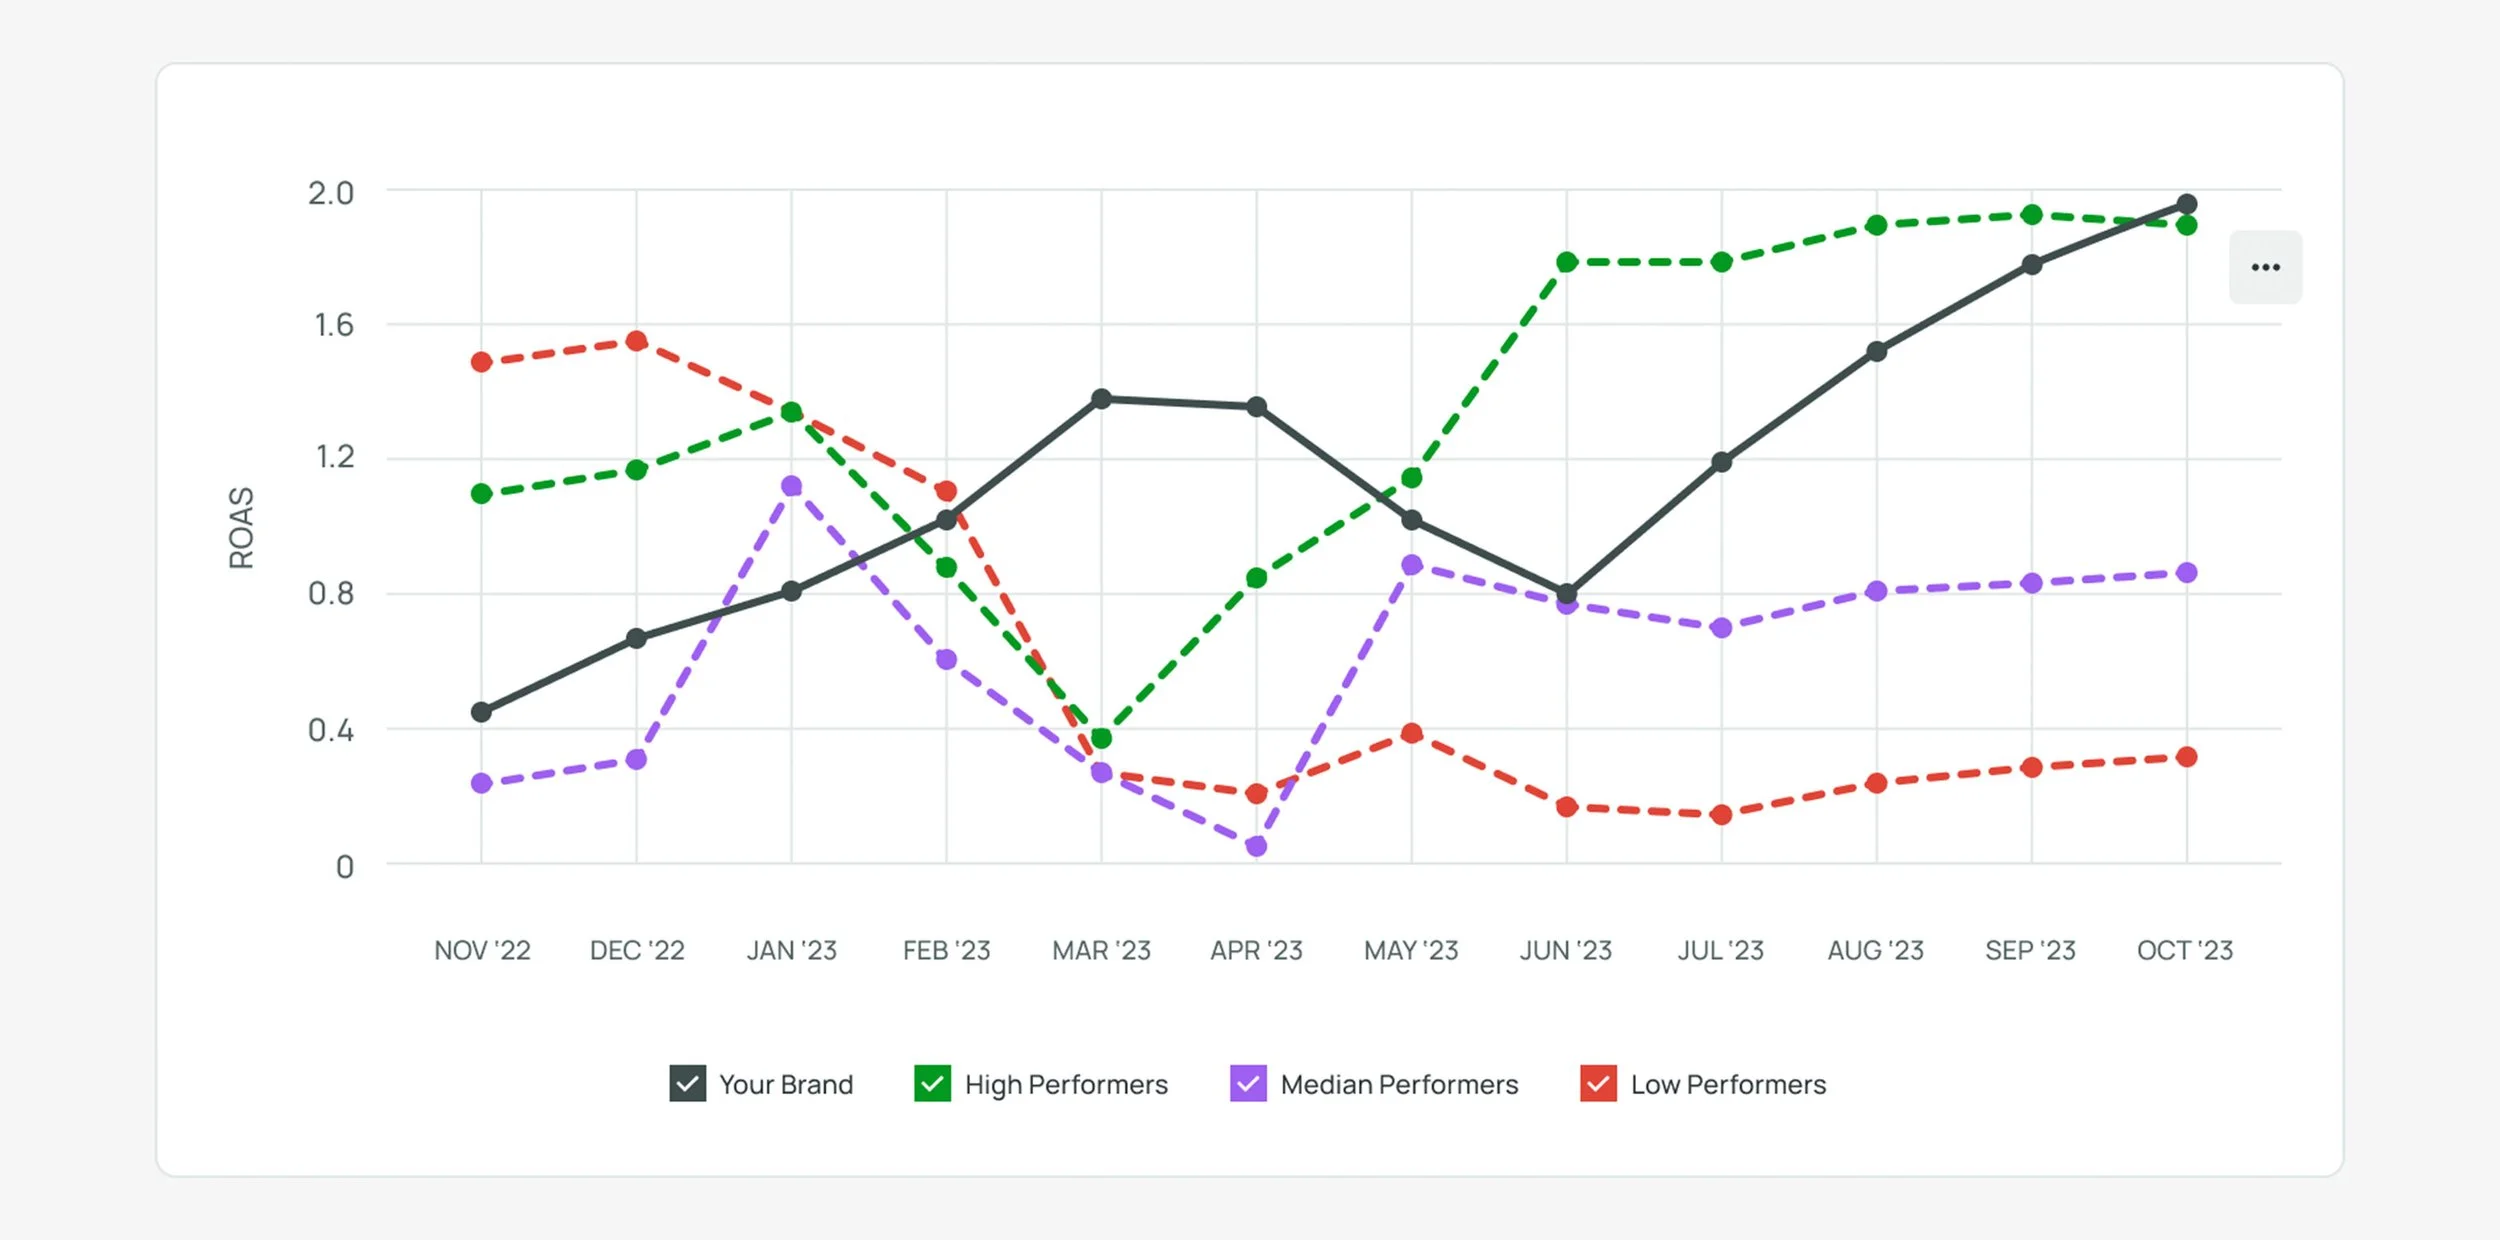
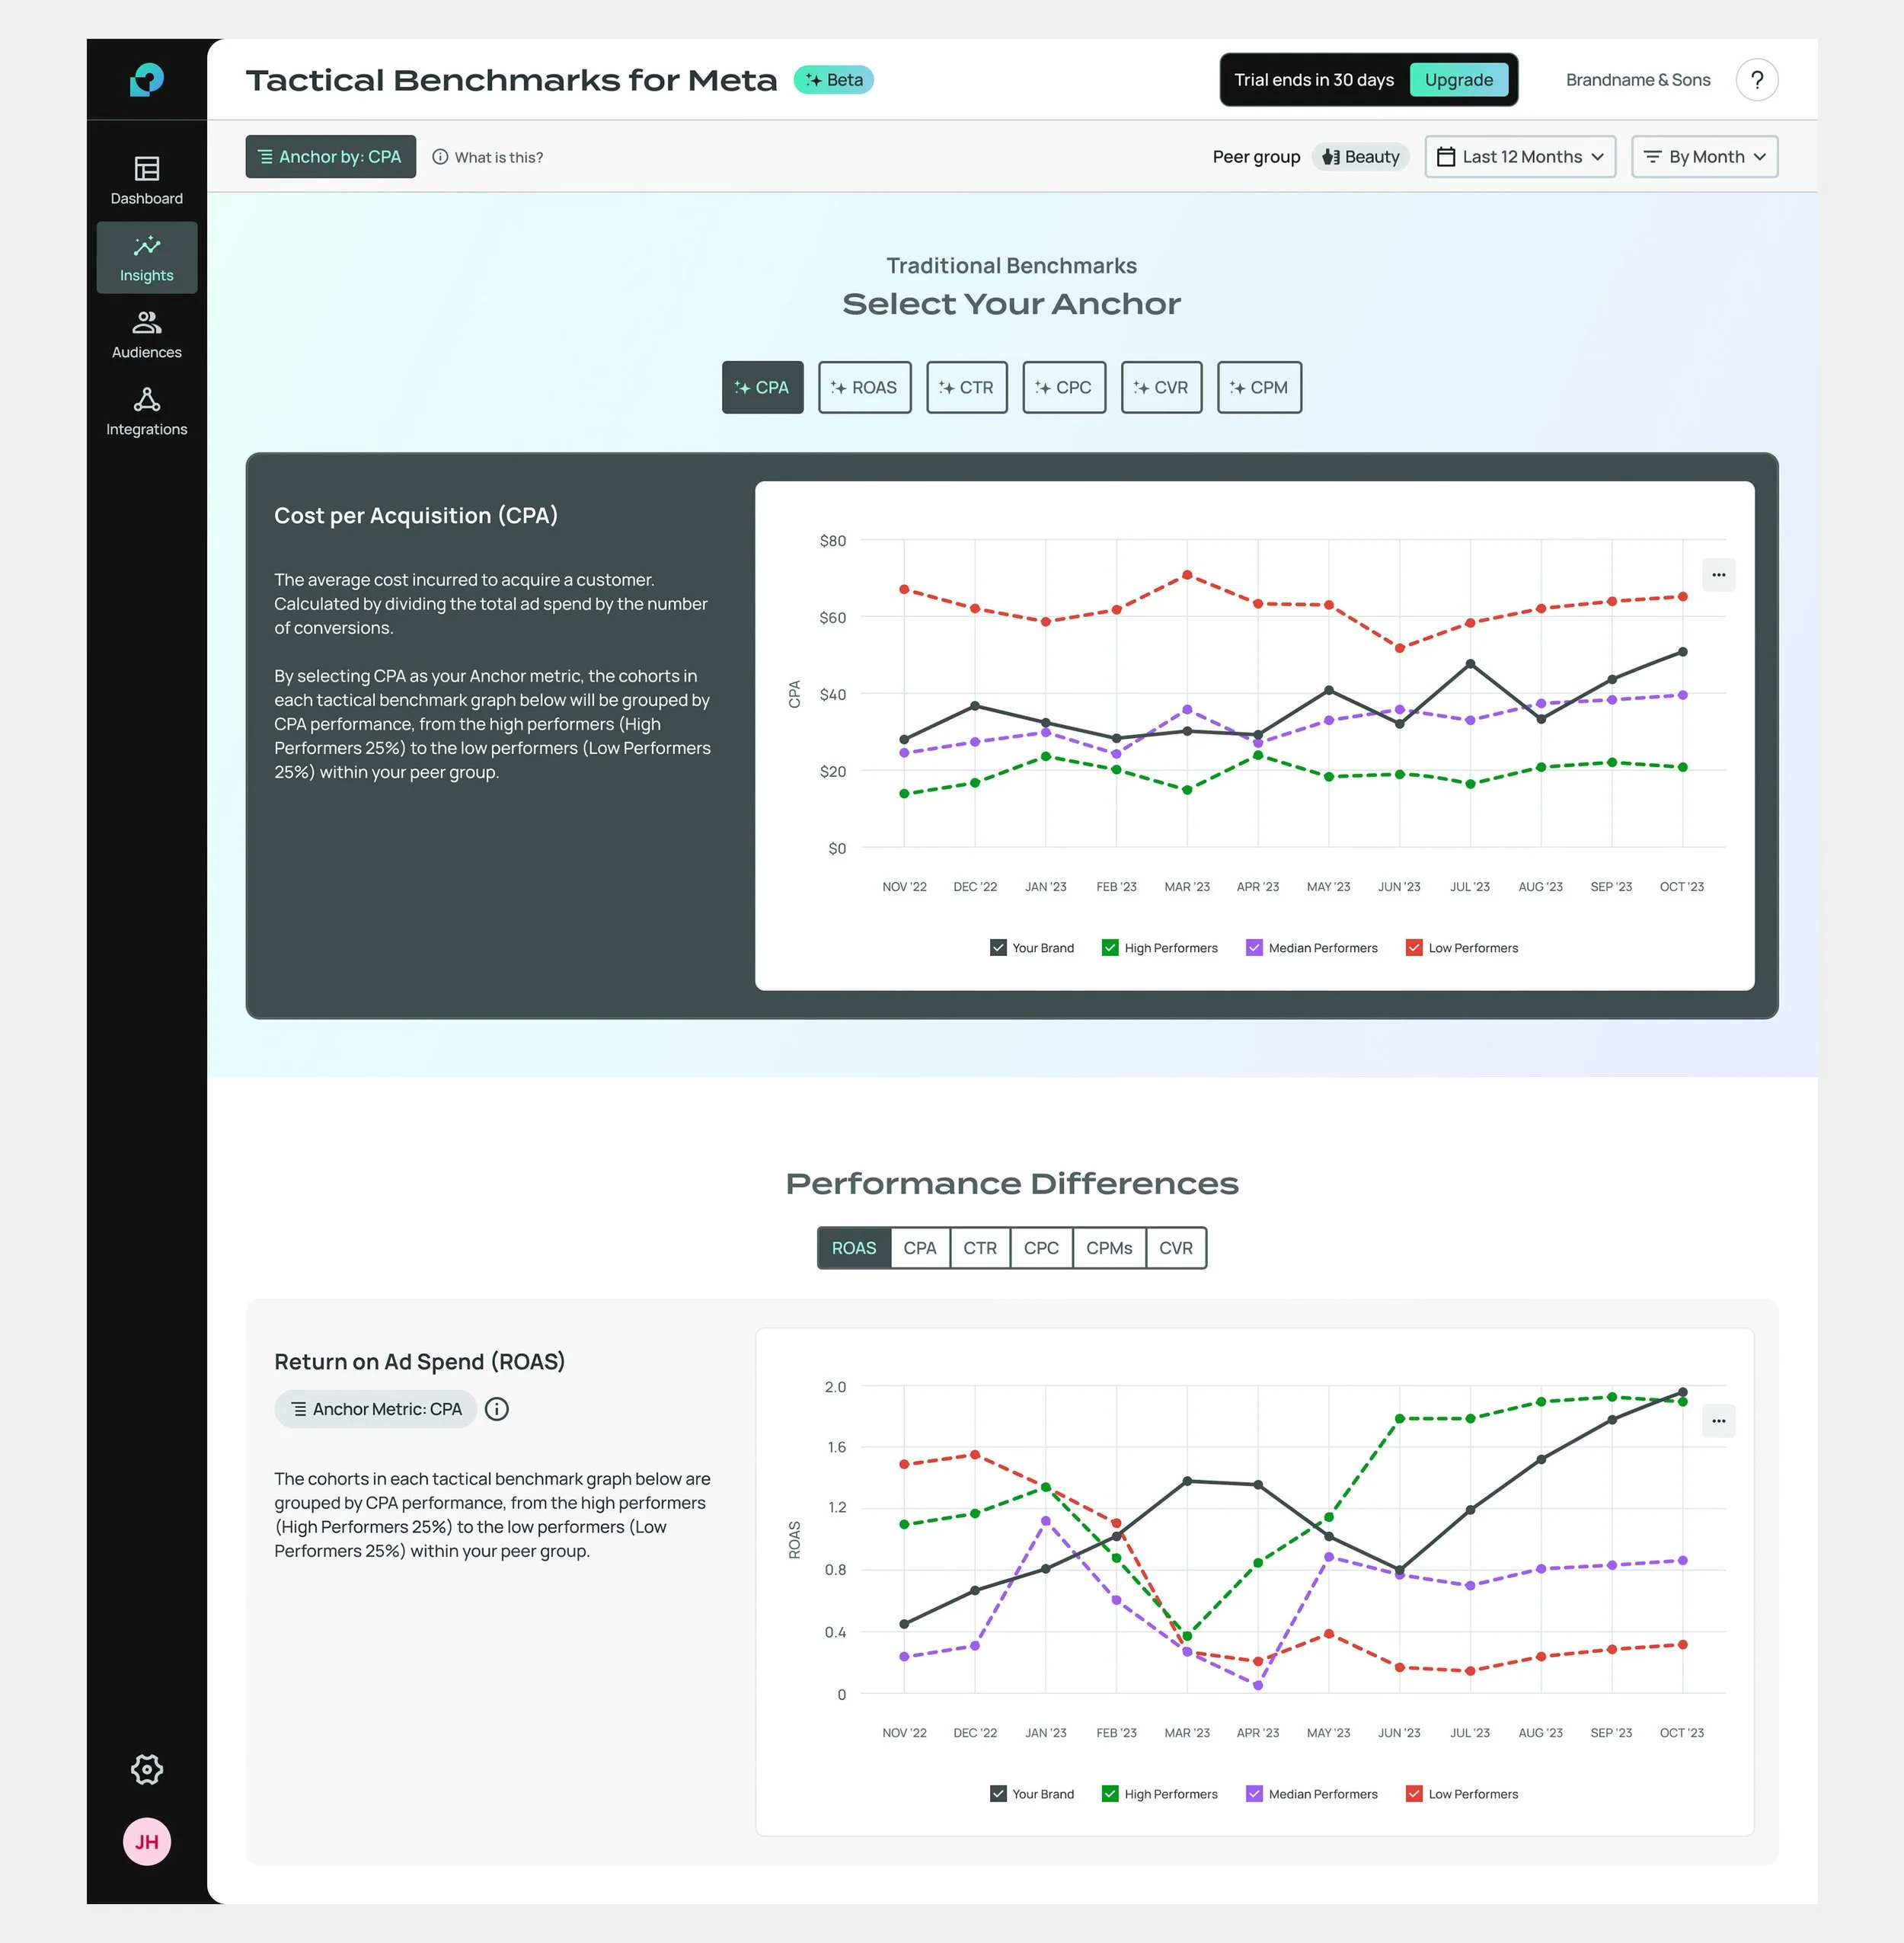
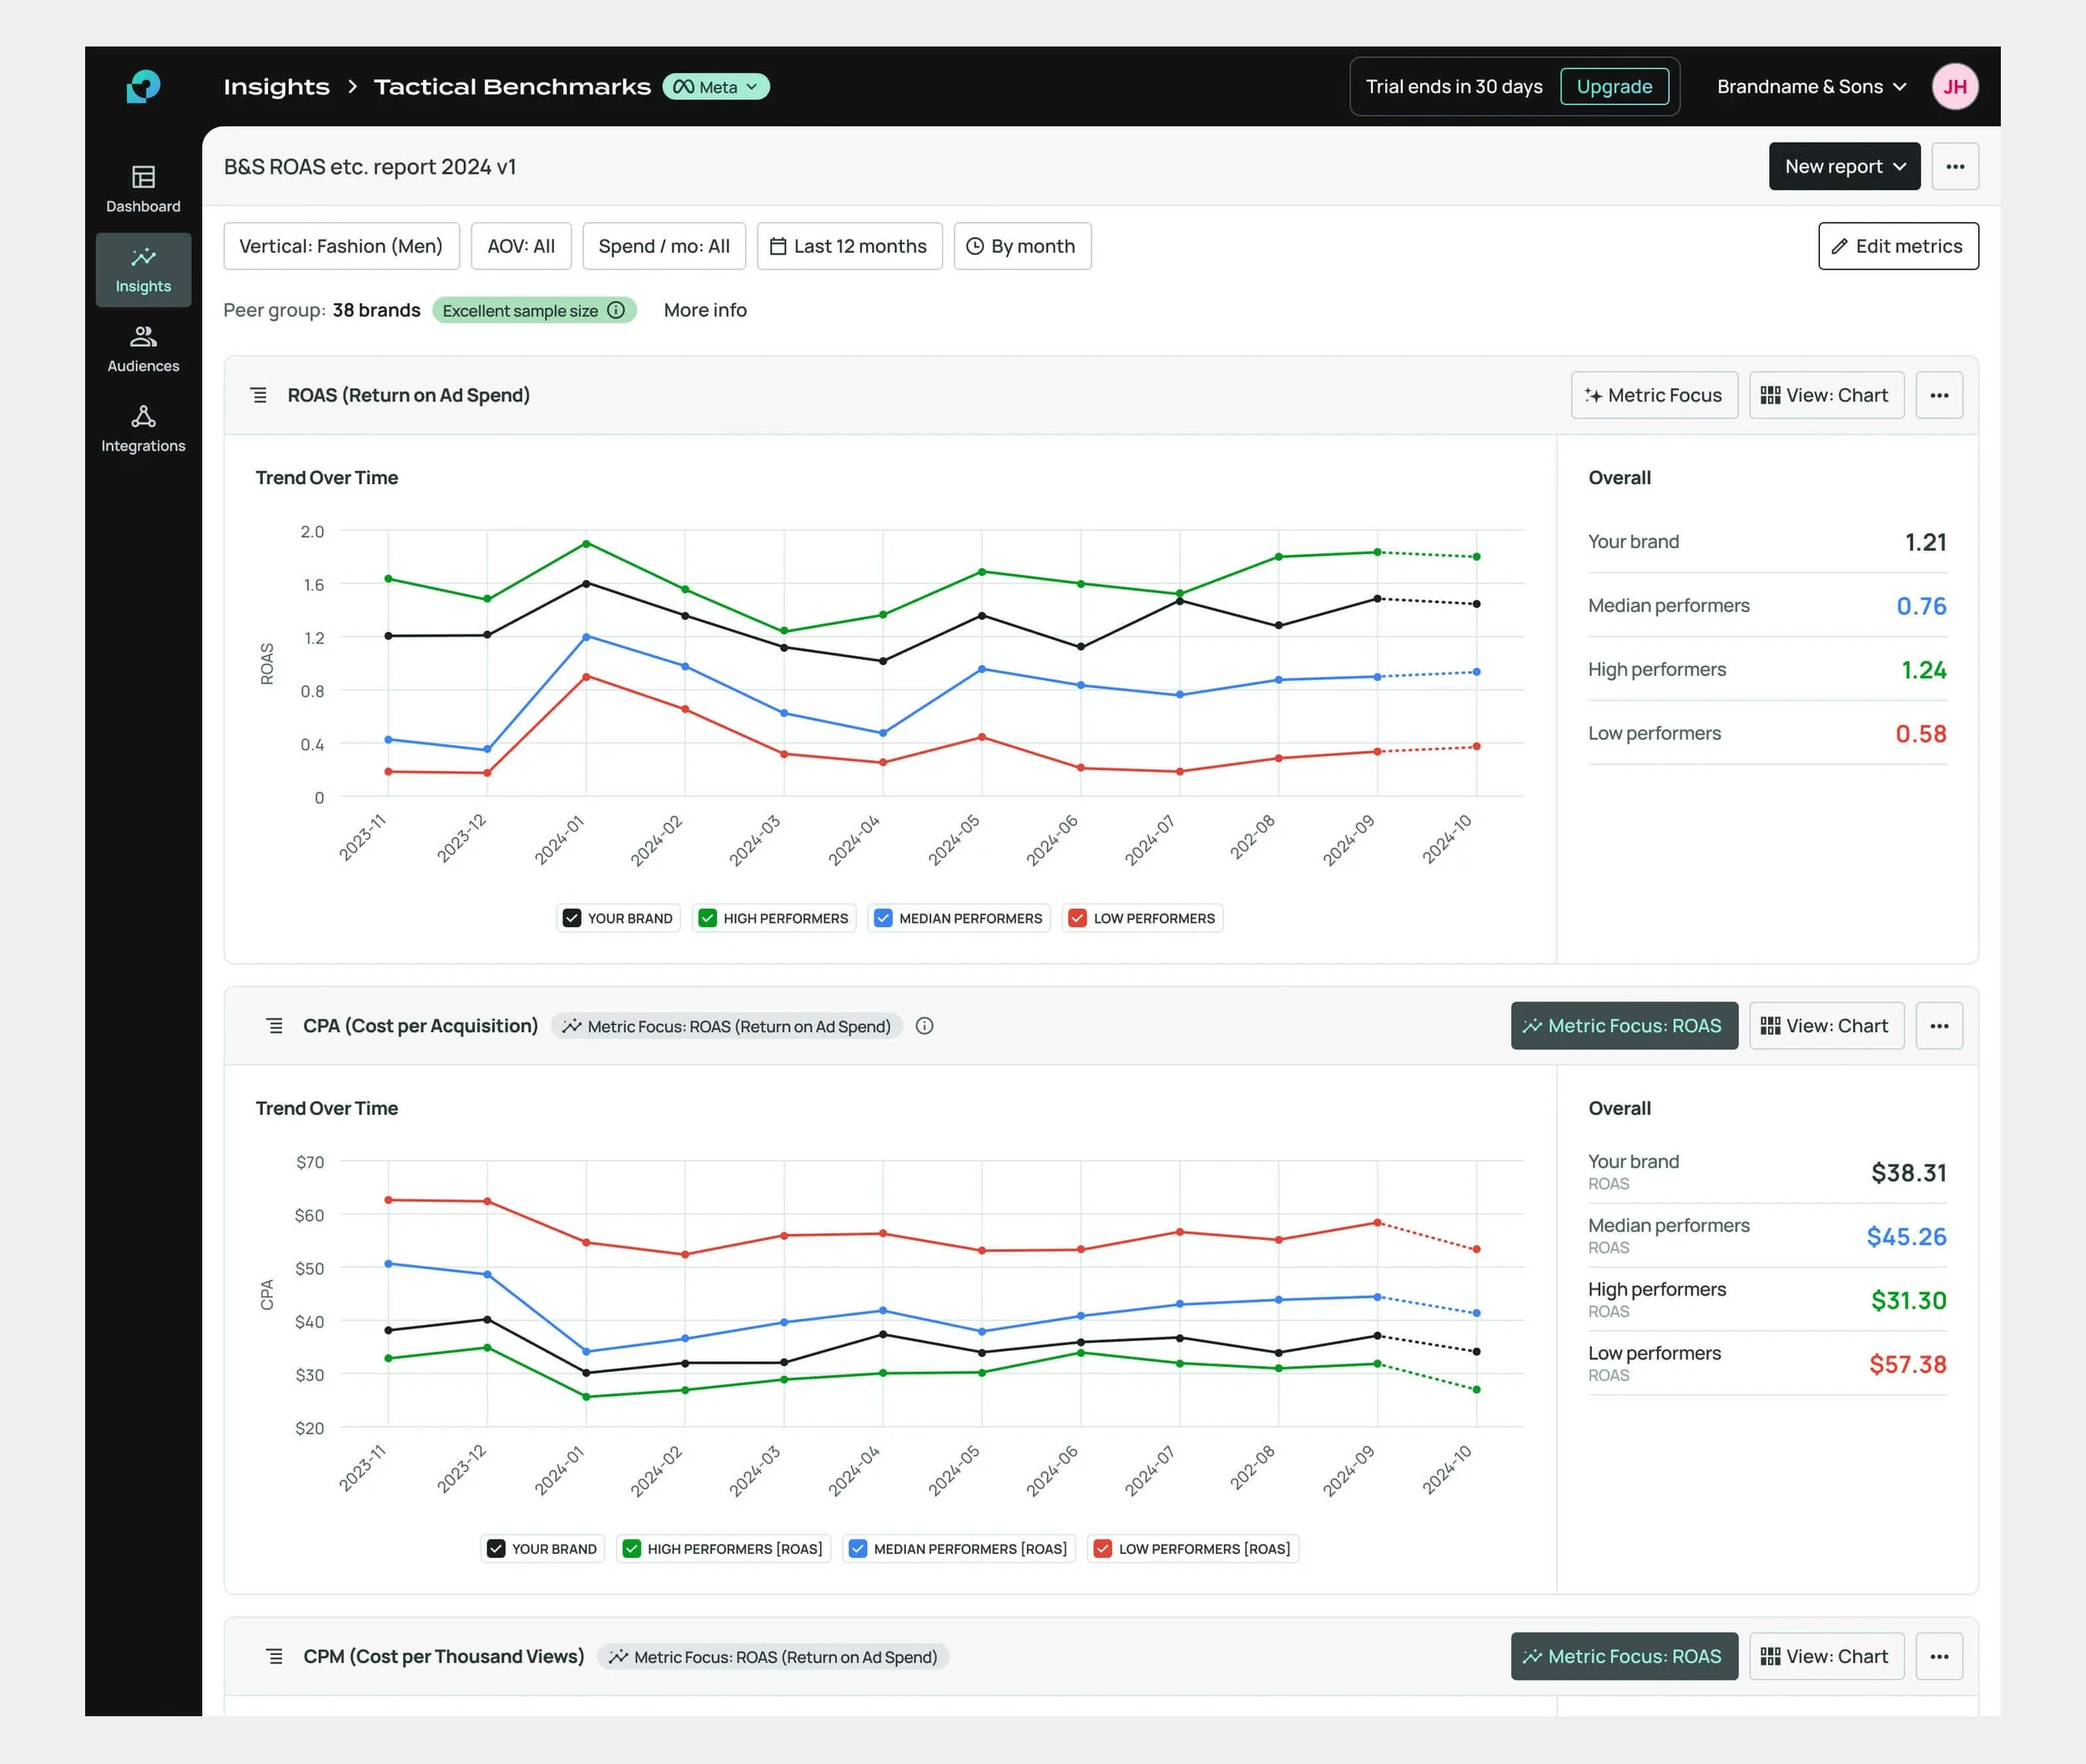
The Tactical Benchmarks Solution
Our breakthrough came when we analyzed performance across multiple metrics. Instead of isolated comparisons, Tactical Benchmarks lets users benchmark Metric A against cohorts based on Metric B’s performance.
This concept, which we called Anchoring, became the foundation of Tactical Benchmarks. By introducing multi-metric benchmarking, we gave brands deeper performance insights to refine their marketing strategies.
Design Process
Methodology

We used the Double Diamond method to develop Tactical Benchmarks and guide future insights tools. During Discovery, research included interviews with internal data analysts, consultant partners, and growth marketers. The Define phase involved building a prototype and user testing to validate key assumptions.
Wireframing
Scope was defined by the need for a rapid MVP launch and limited engineering bandwidth. With most engineers focused on the backend, our 1-2 frontend engineers also had to integrate a third-party data visualization library.
Early wireframes prioritized proof-of-concept and MVP completion, with refinements based on user testing.

Prototyping, Testing, Interviews
Once the MVP design took shape, we created an interactive Figma prototype for usability testing.
Using realistic data, we tested various benchmarking charts with different metrics and anchor options. Our data science team ensured data realism.
Testing Plan:
Moderated Testing: Interviews and prototype testing with Proxima consultants, trusted clients, and growth marketers (7 participants).
Unmoderated Testing: Prototype testing with ~15 digital growth marketers via Useberry.
Design System Improvements
With new UI components and a data visualization system, we transitioned to the Celes Design System, introducing semantic tokens and refining interaction styling.
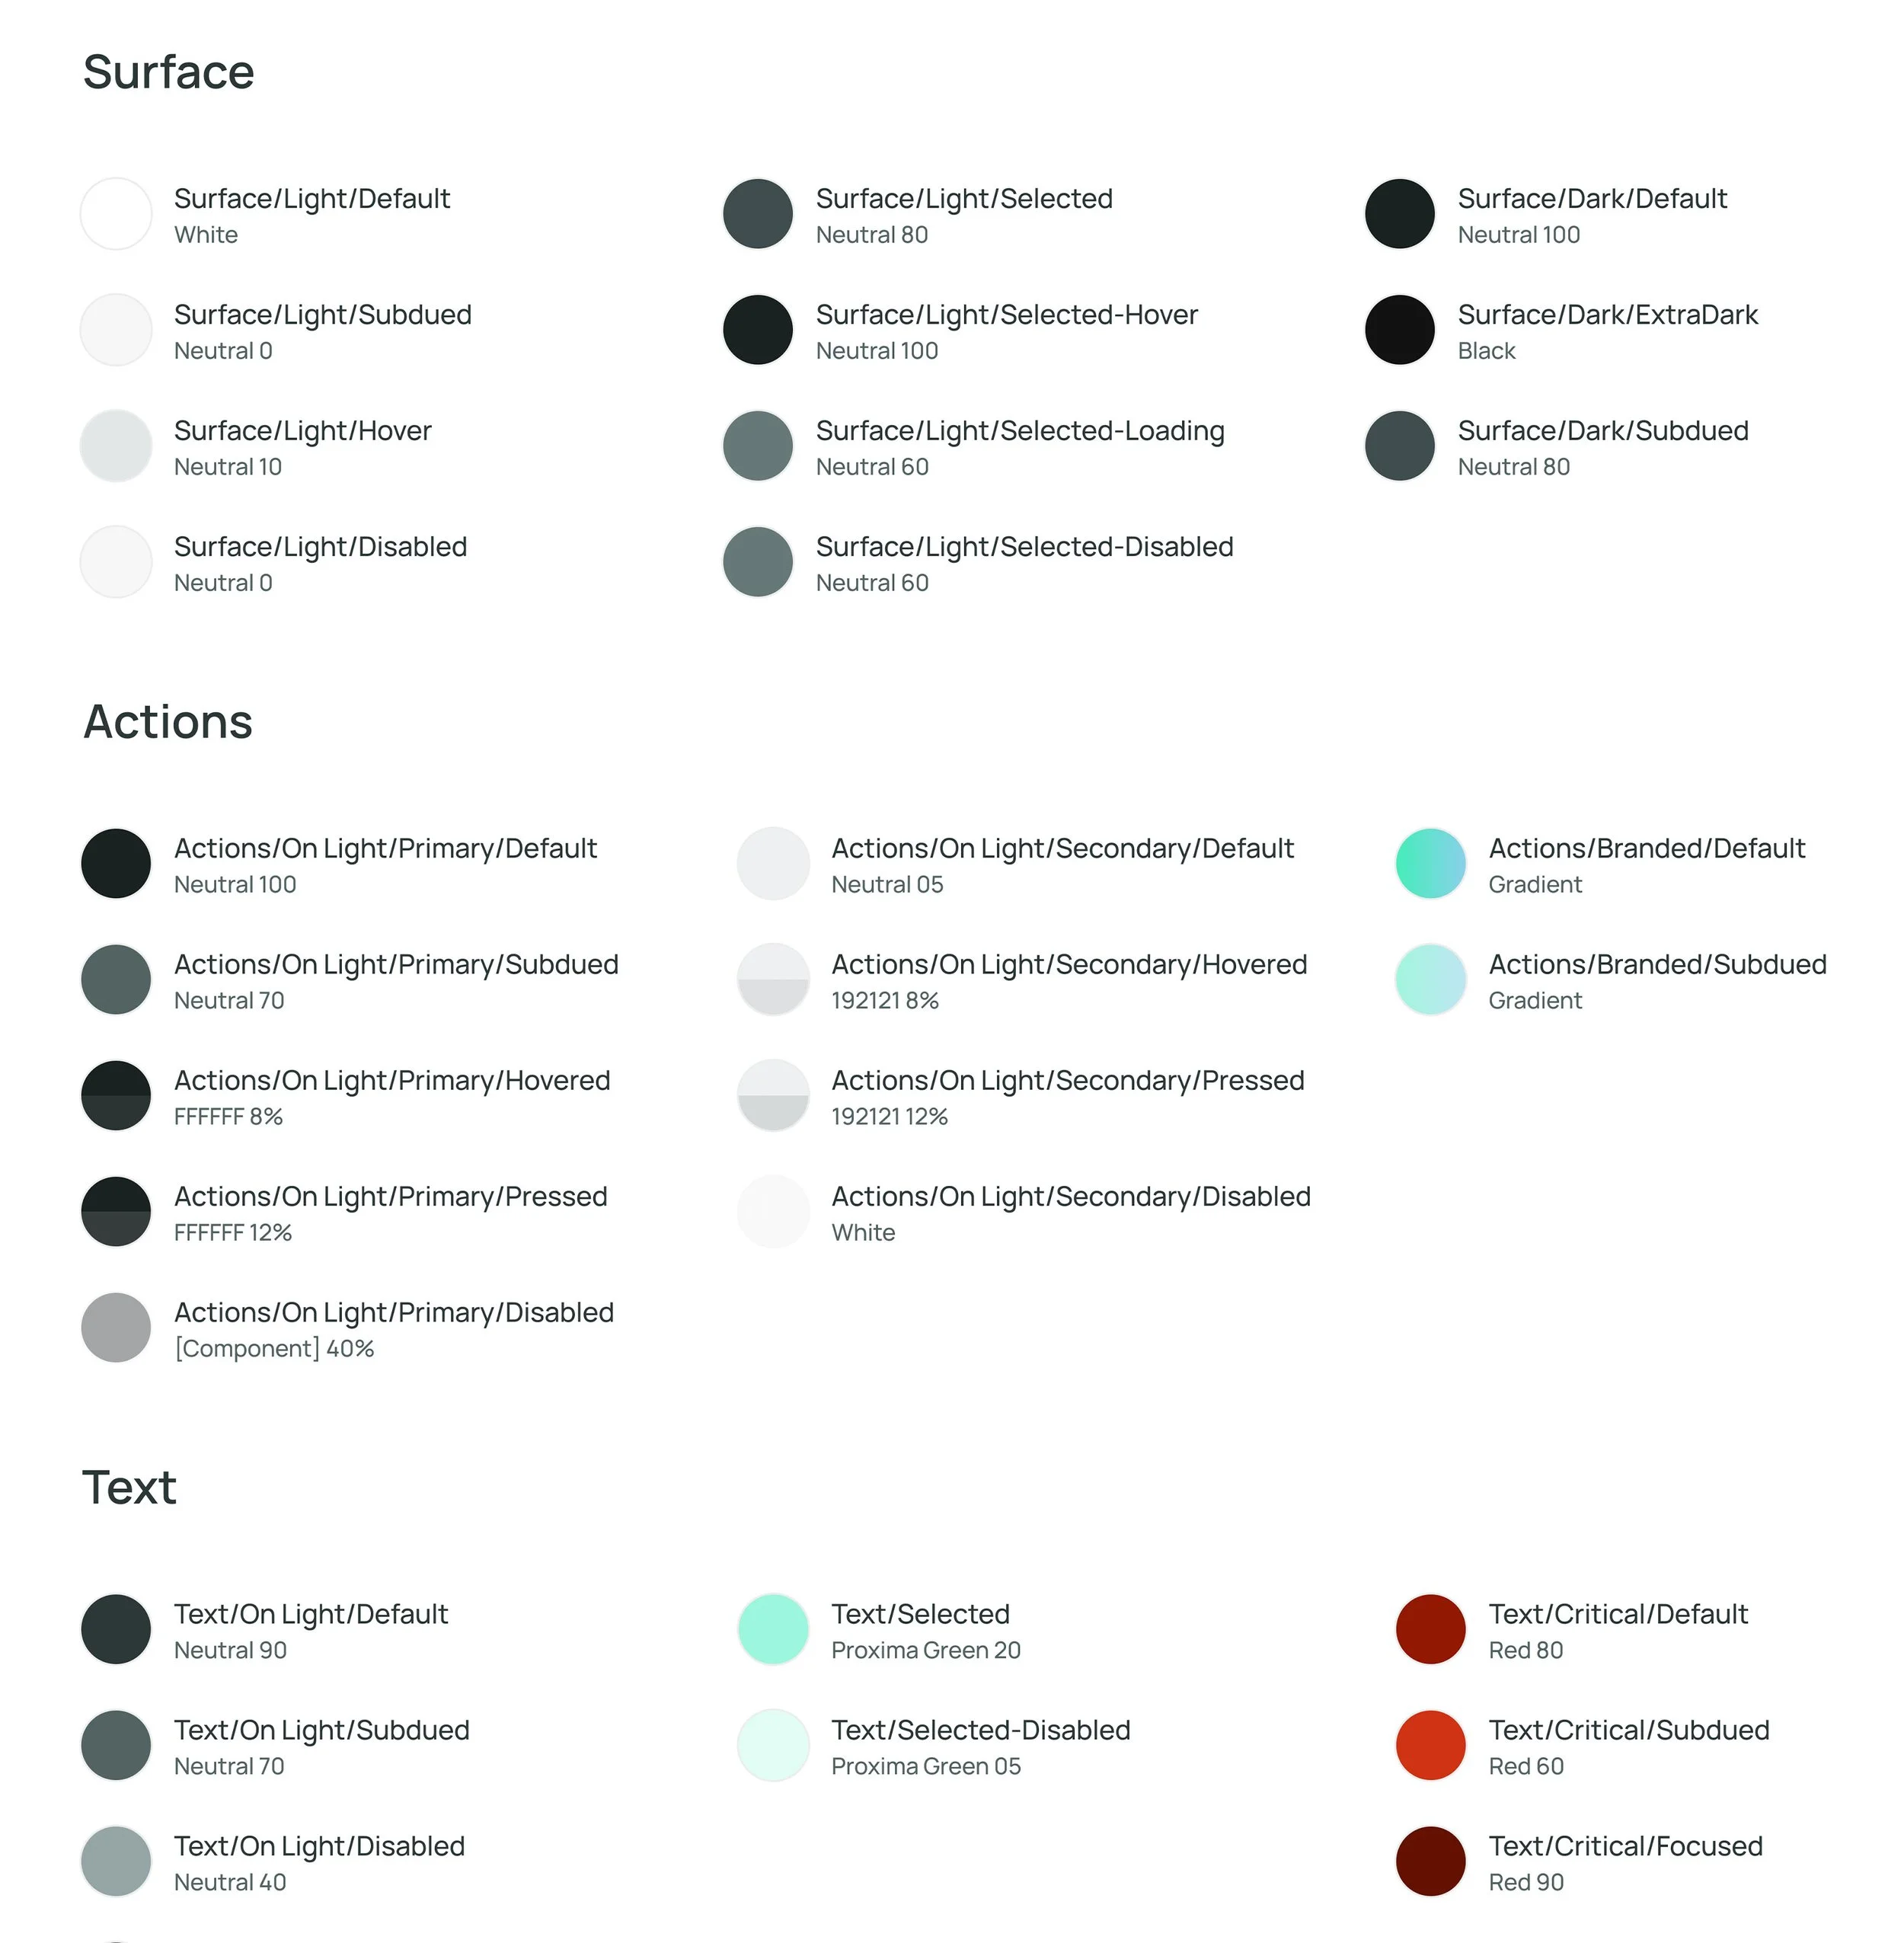
Semantic Tokens
To improve scalability, I introduced semantic tokens, replacing inefficient universal color styles. This made styling and future updates easier. I worked with frontend engineers to implement them in Storybook, ensuring design-to-dev fidelity.
Interaction Styling & Logic
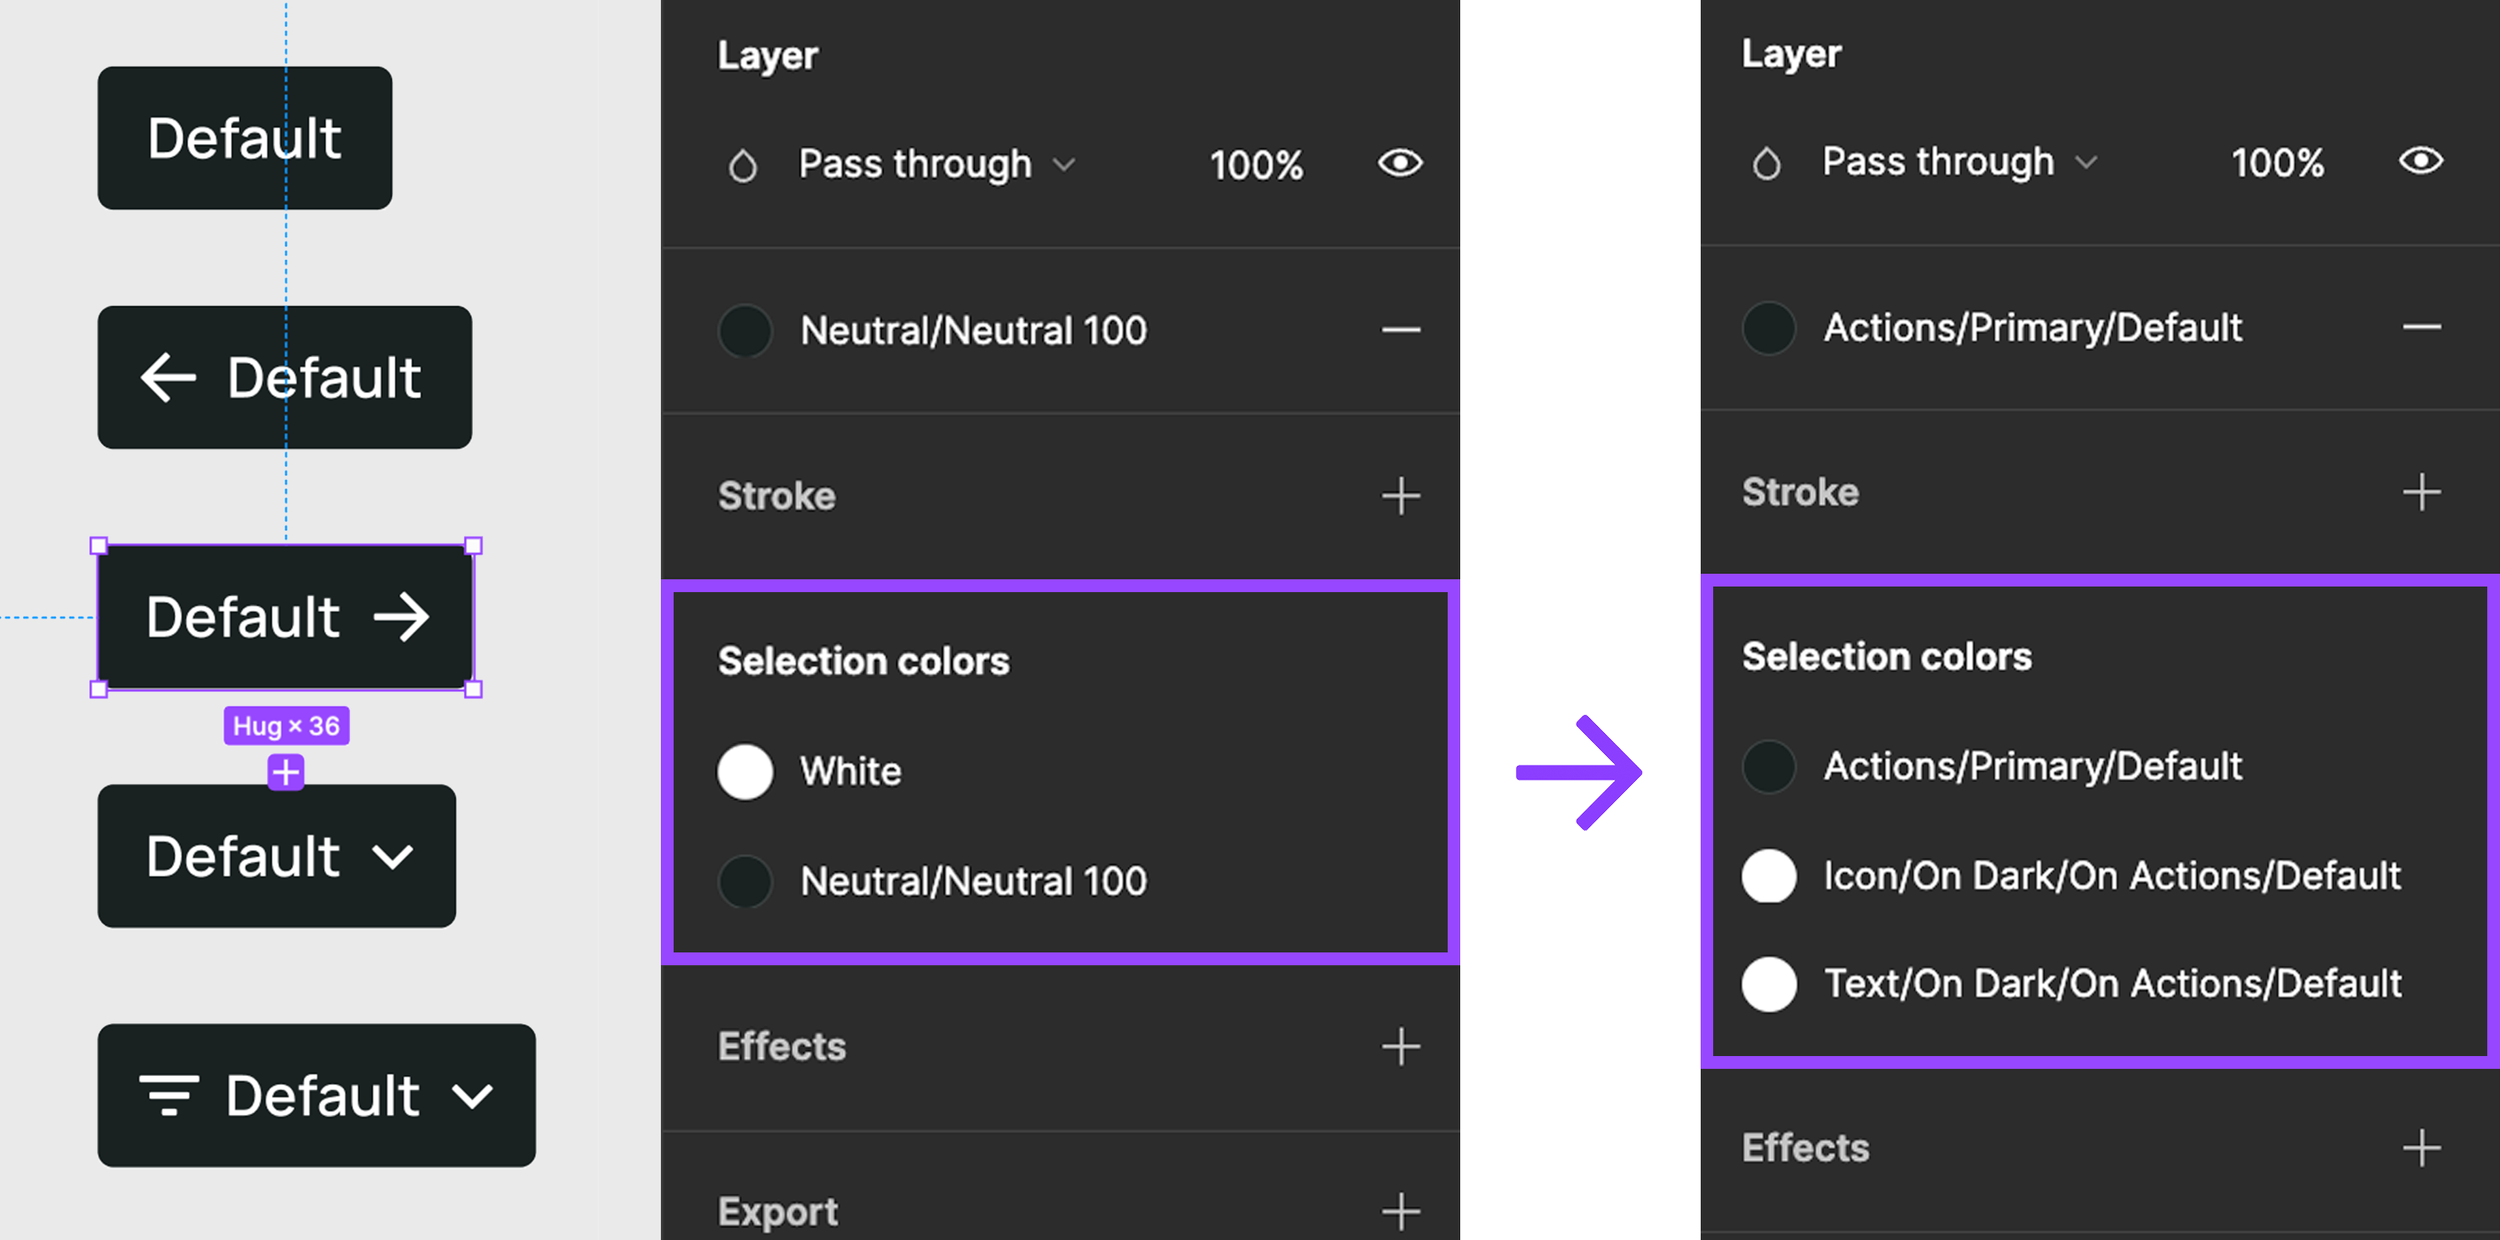
Previously, interactive component states relied on solid color swaps, causing contrast issues on certain backgrounds. I redesigned them using transparency-based logic for consistent visibility across UI contexts.

Data Visualization
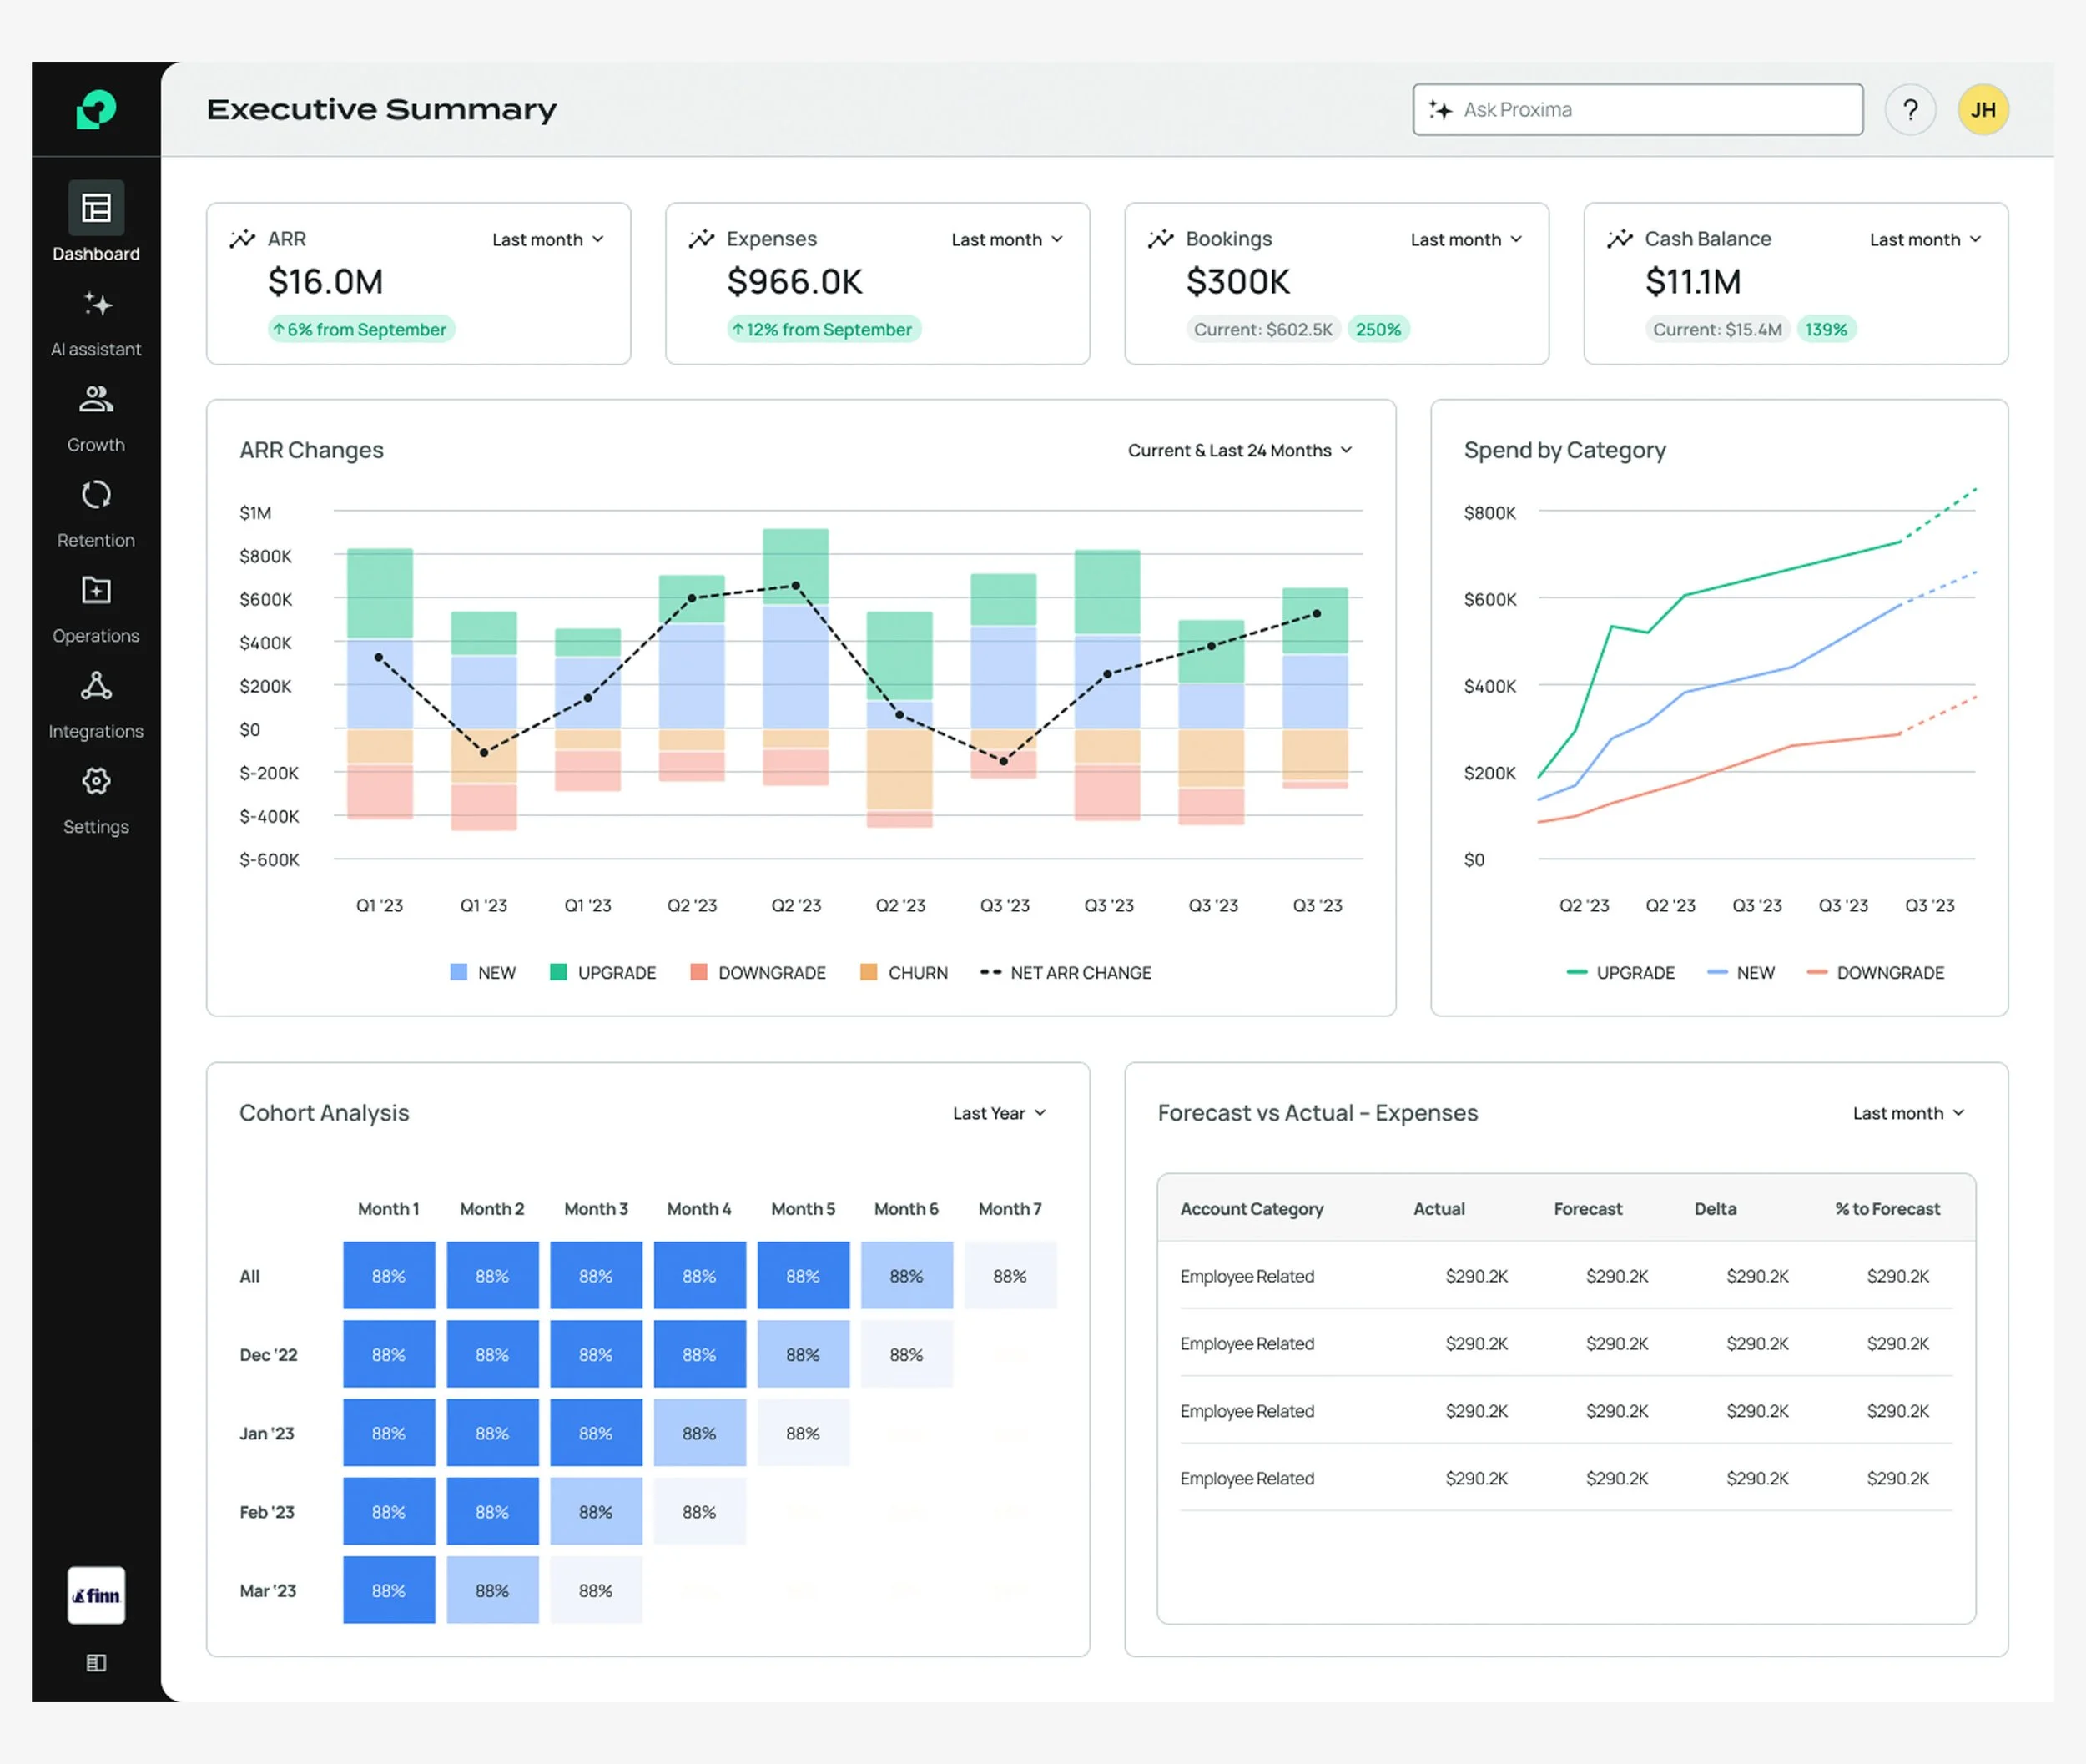
Ahead of Series A, I designed and prototyped a North Star concept showcasing Proxima’s vision. This informed our design system redesign and data visualization approach.
To stay lean, we customized Highcharts to fit our design language, requiring close dev-design collaboration. Initial designs used soft colors and high-contrast black for user data, later adjusted for accessibility compliance.

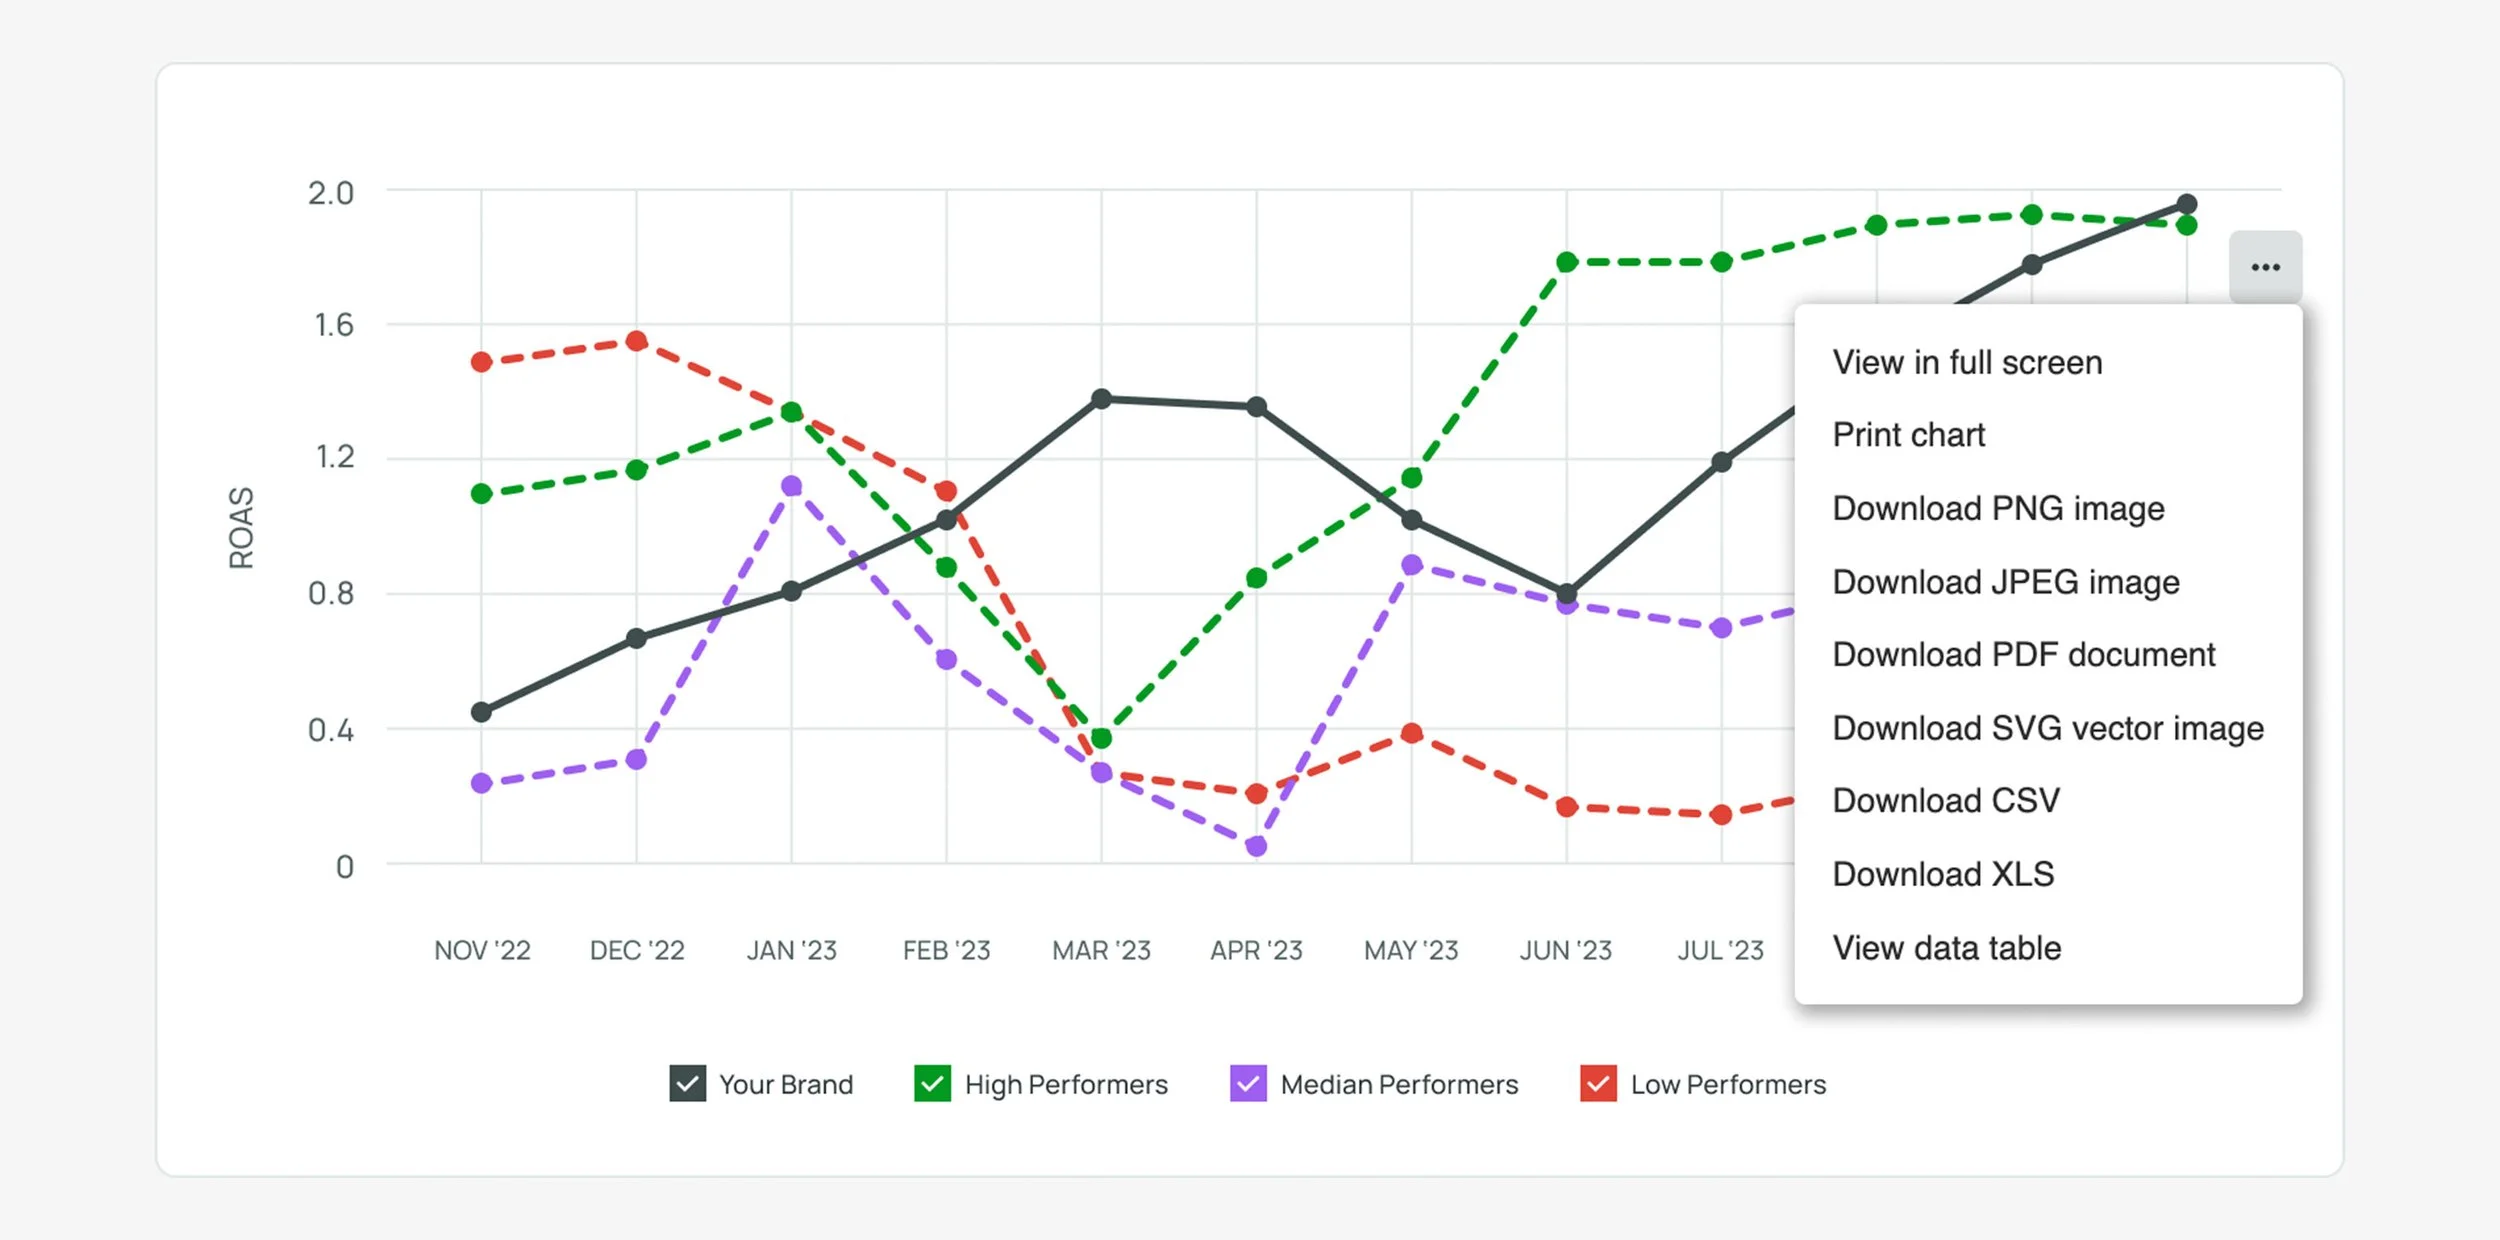
Note: the awkward position of the actions menu was due to a Highcharts issue that could not be troubleshot until later.
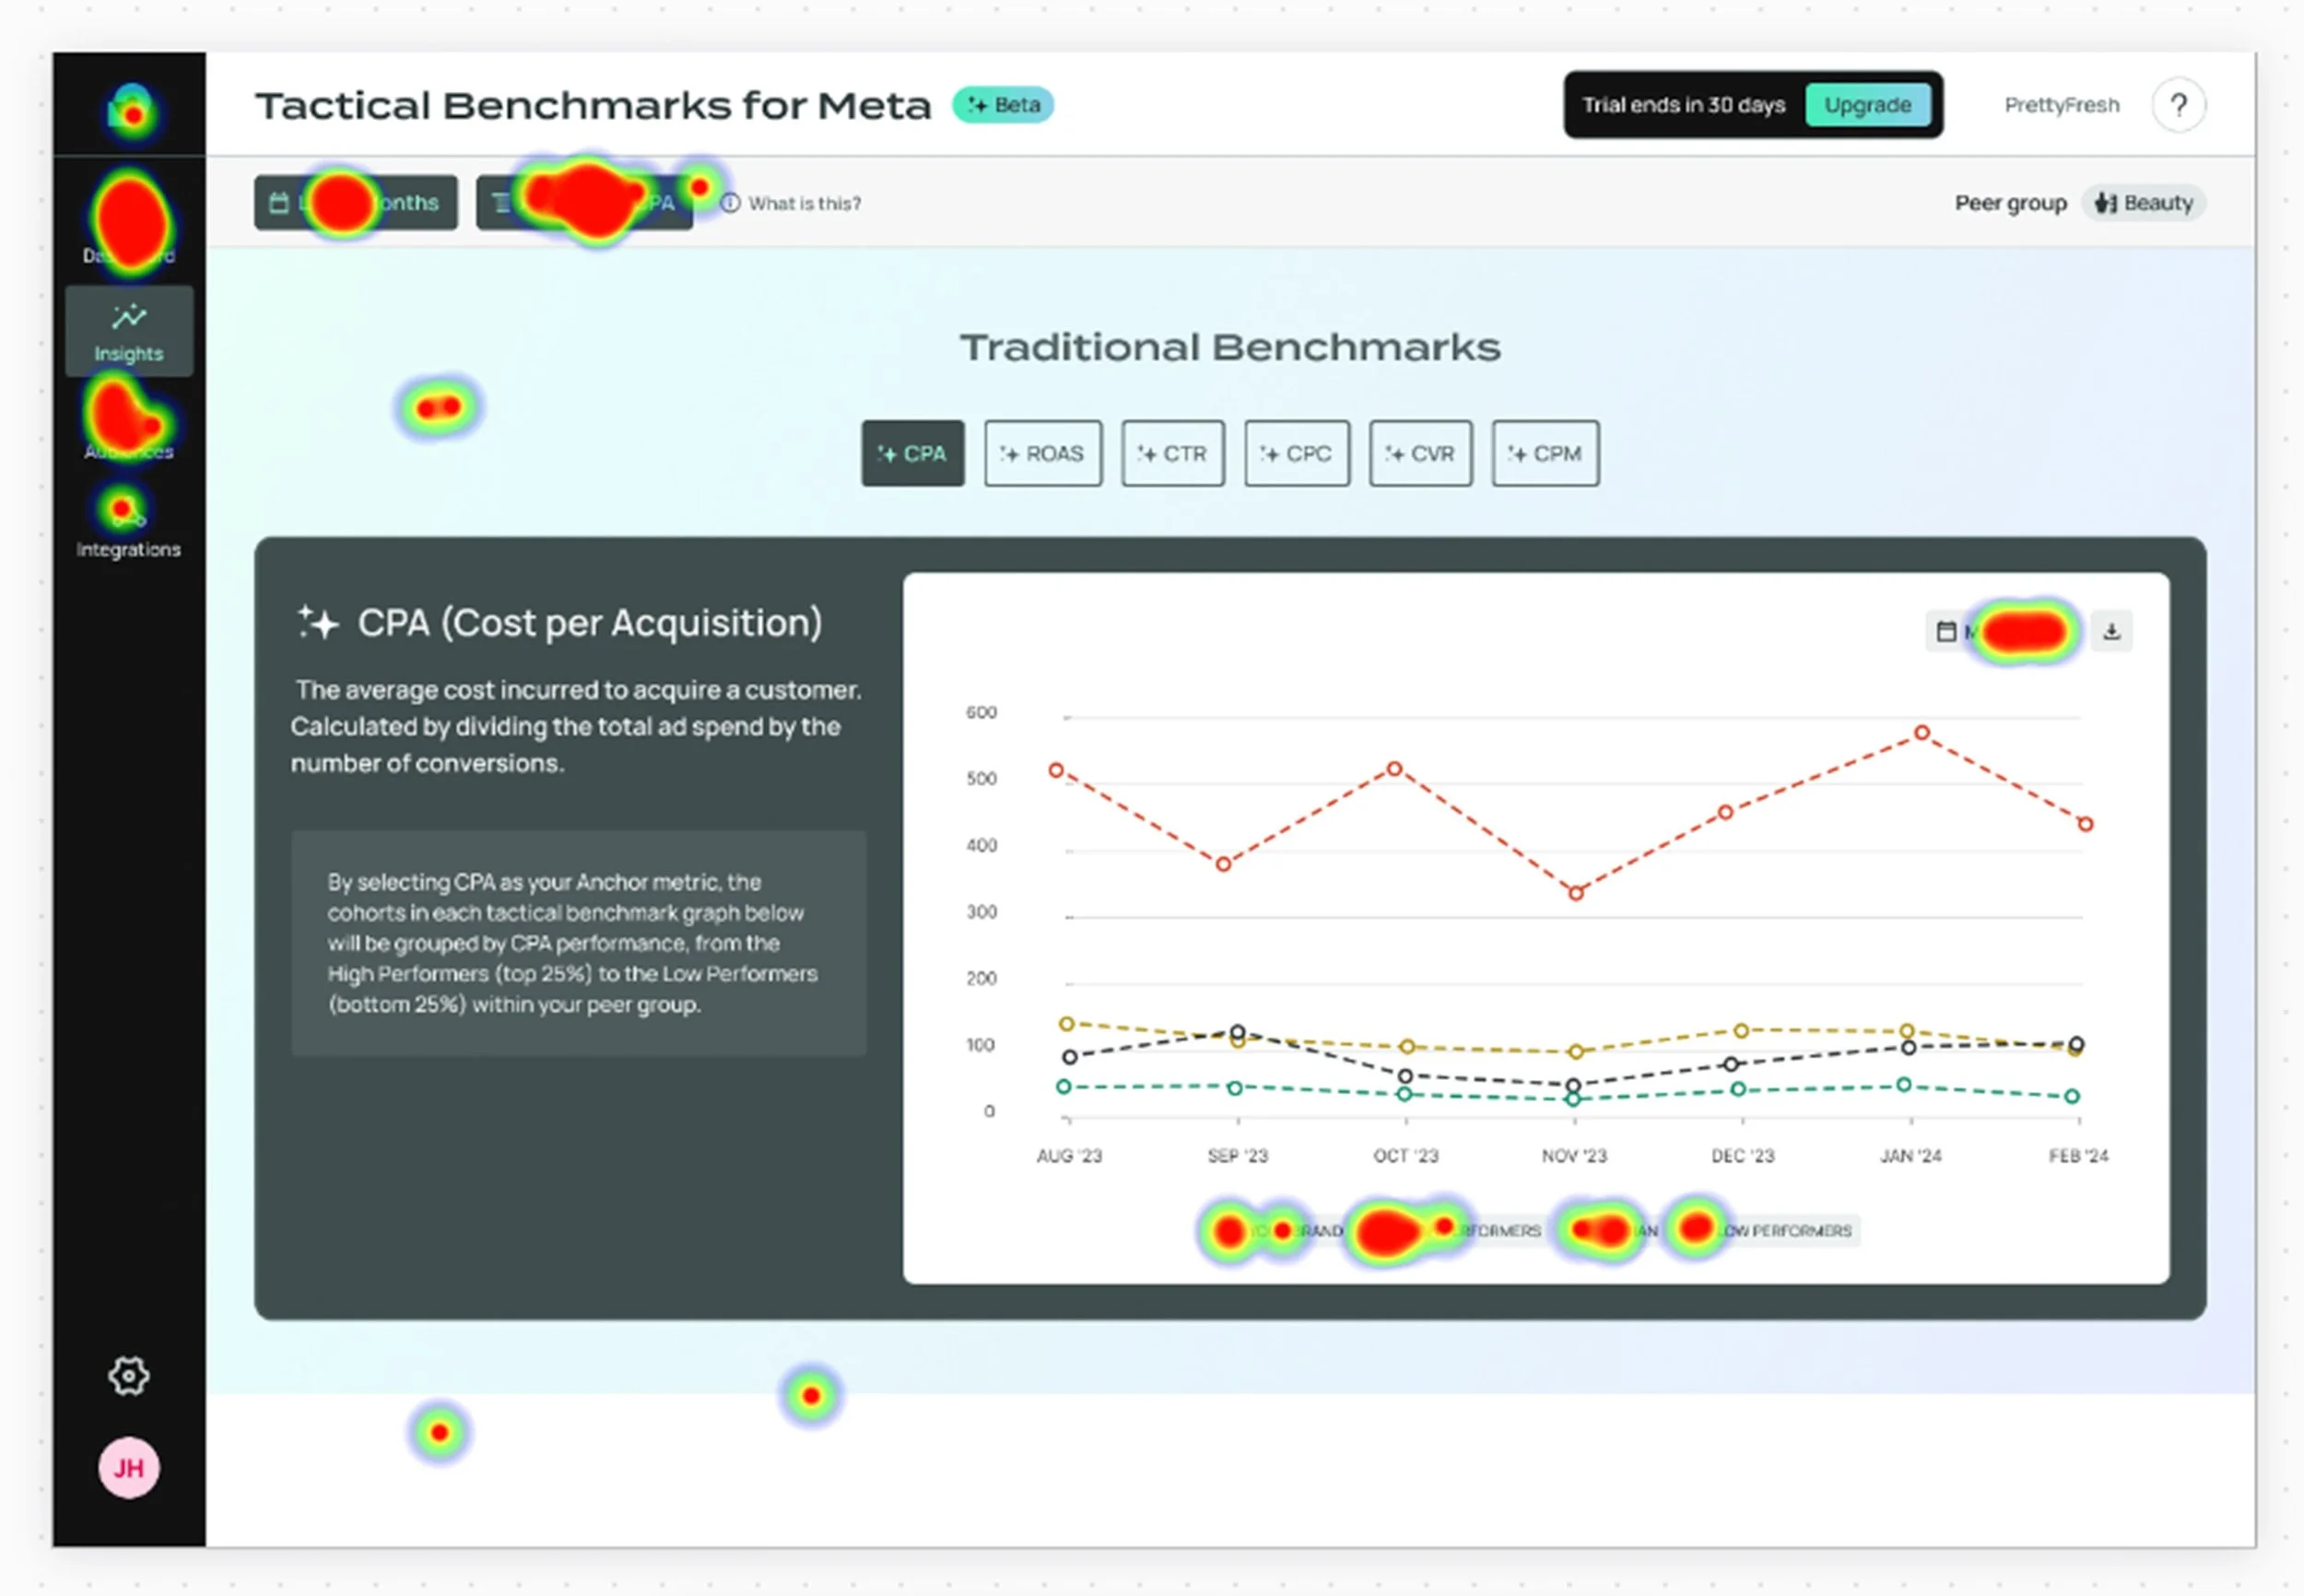
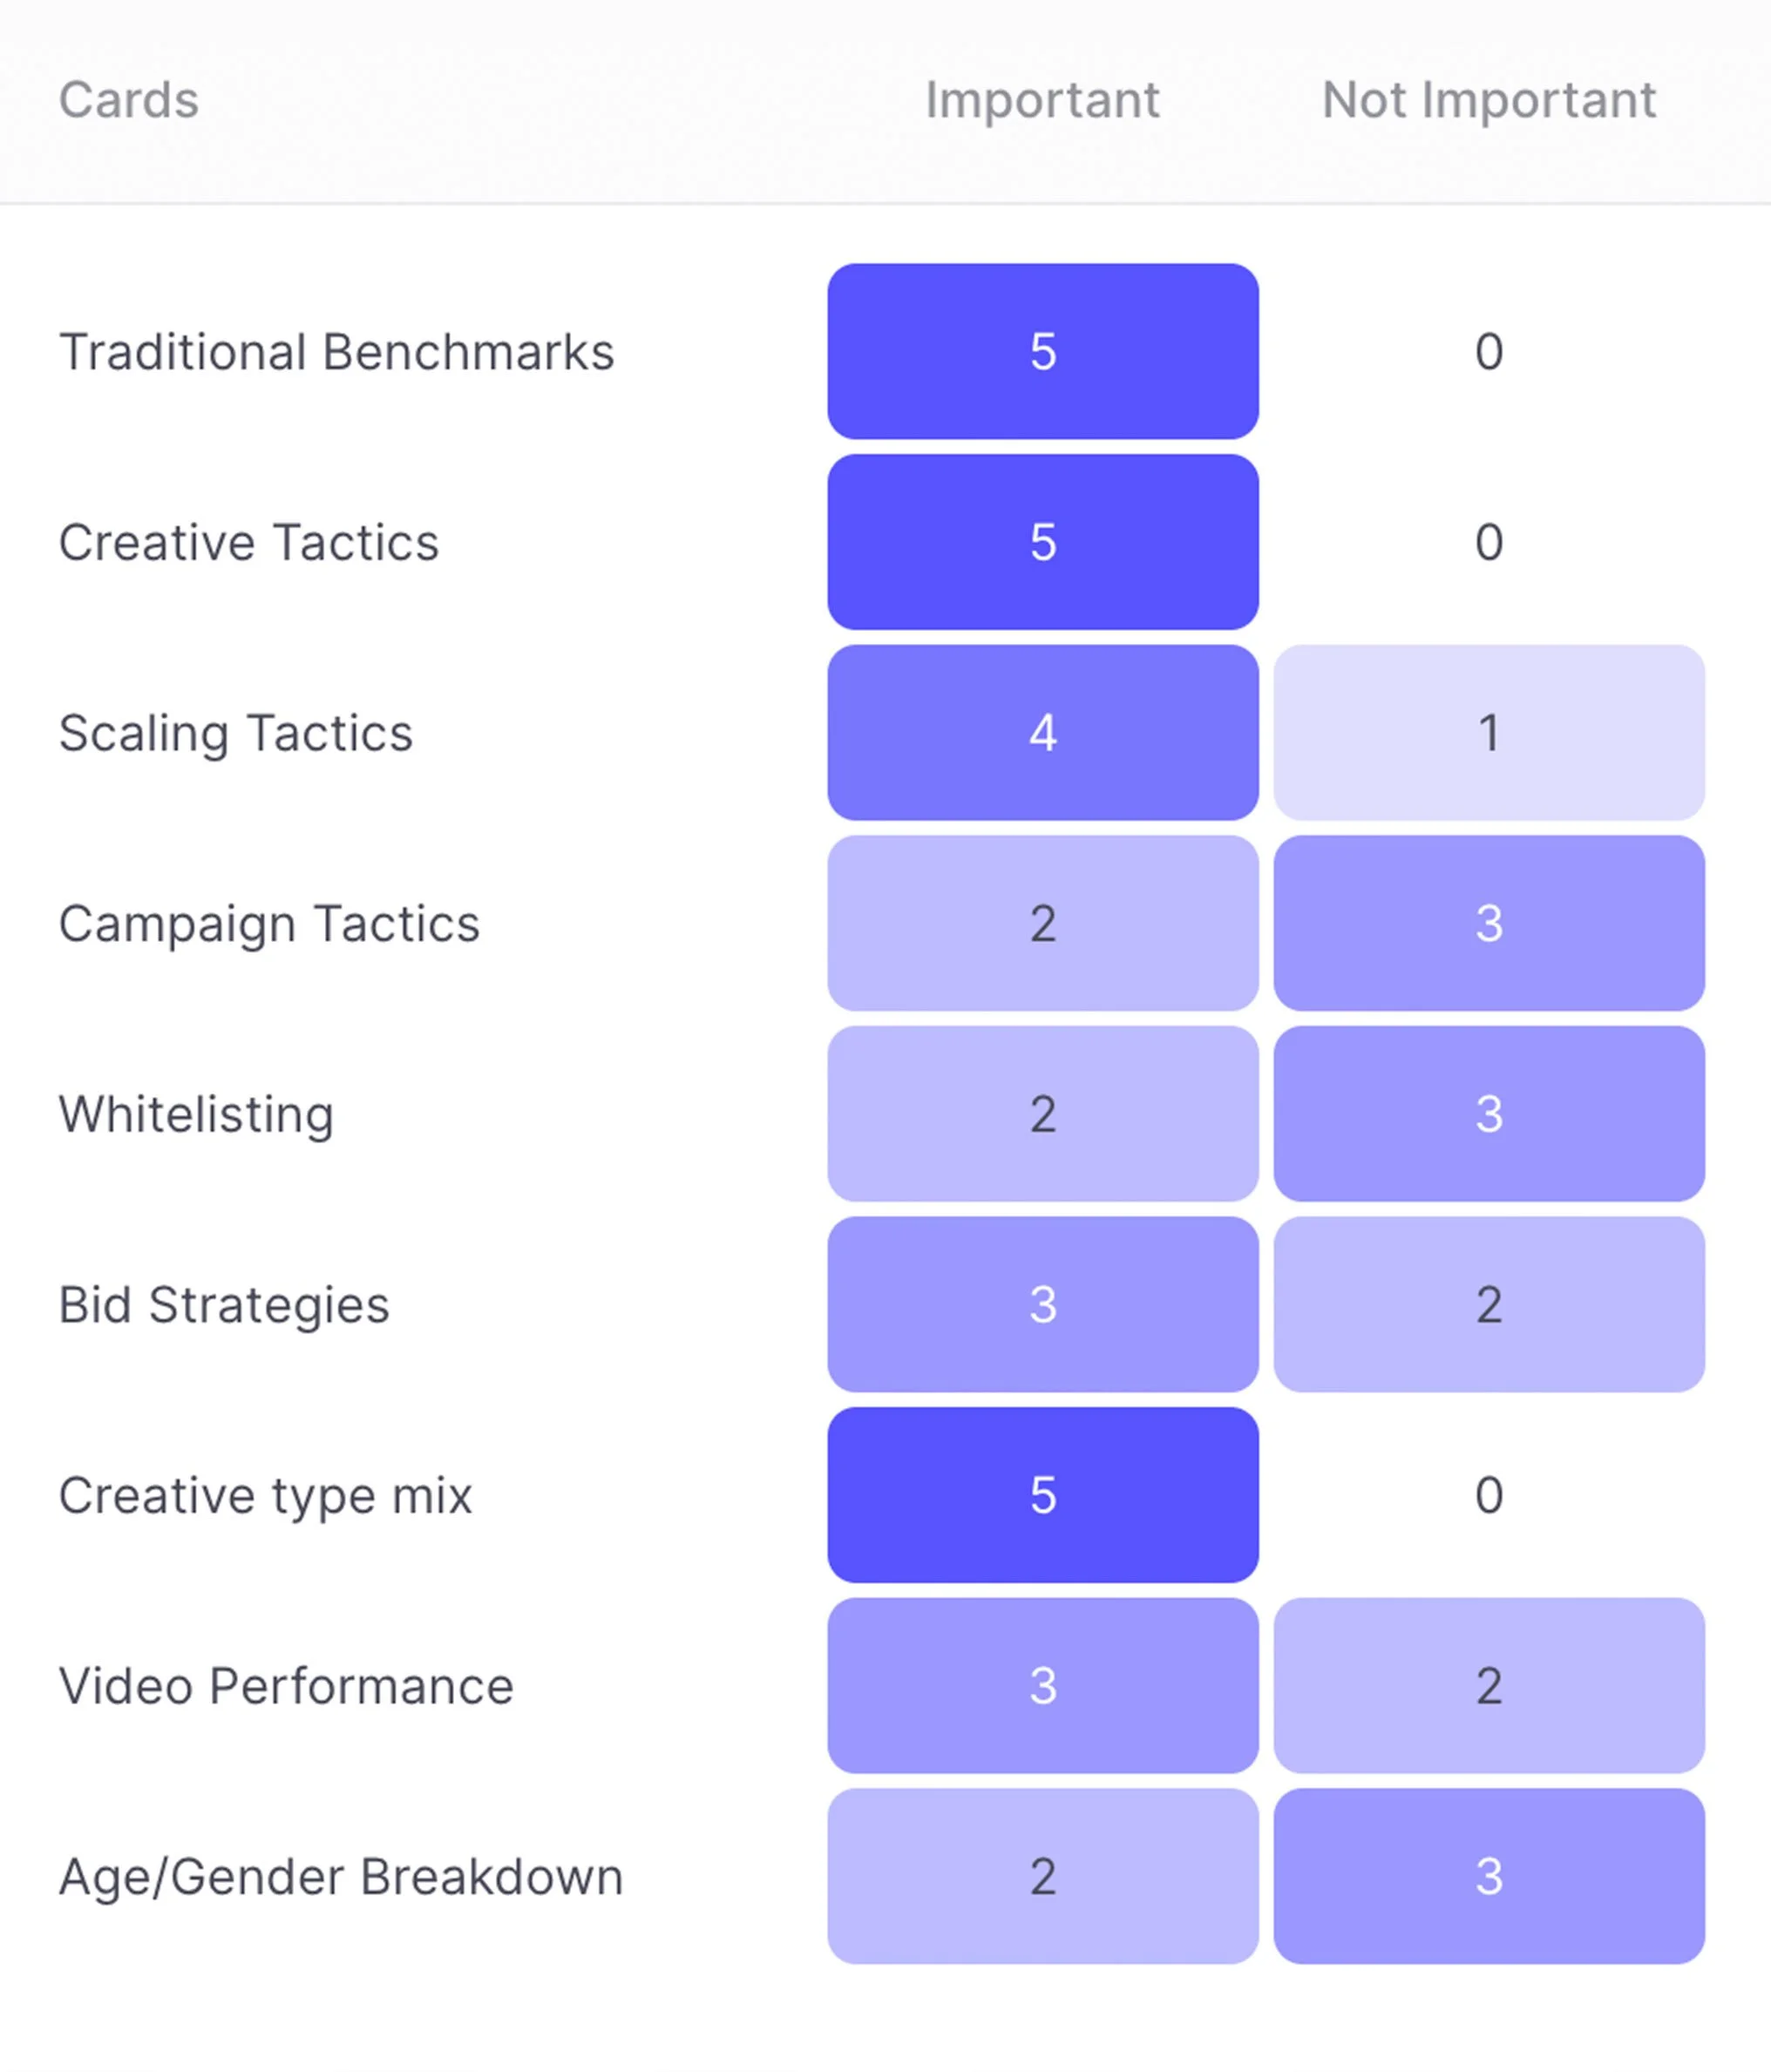
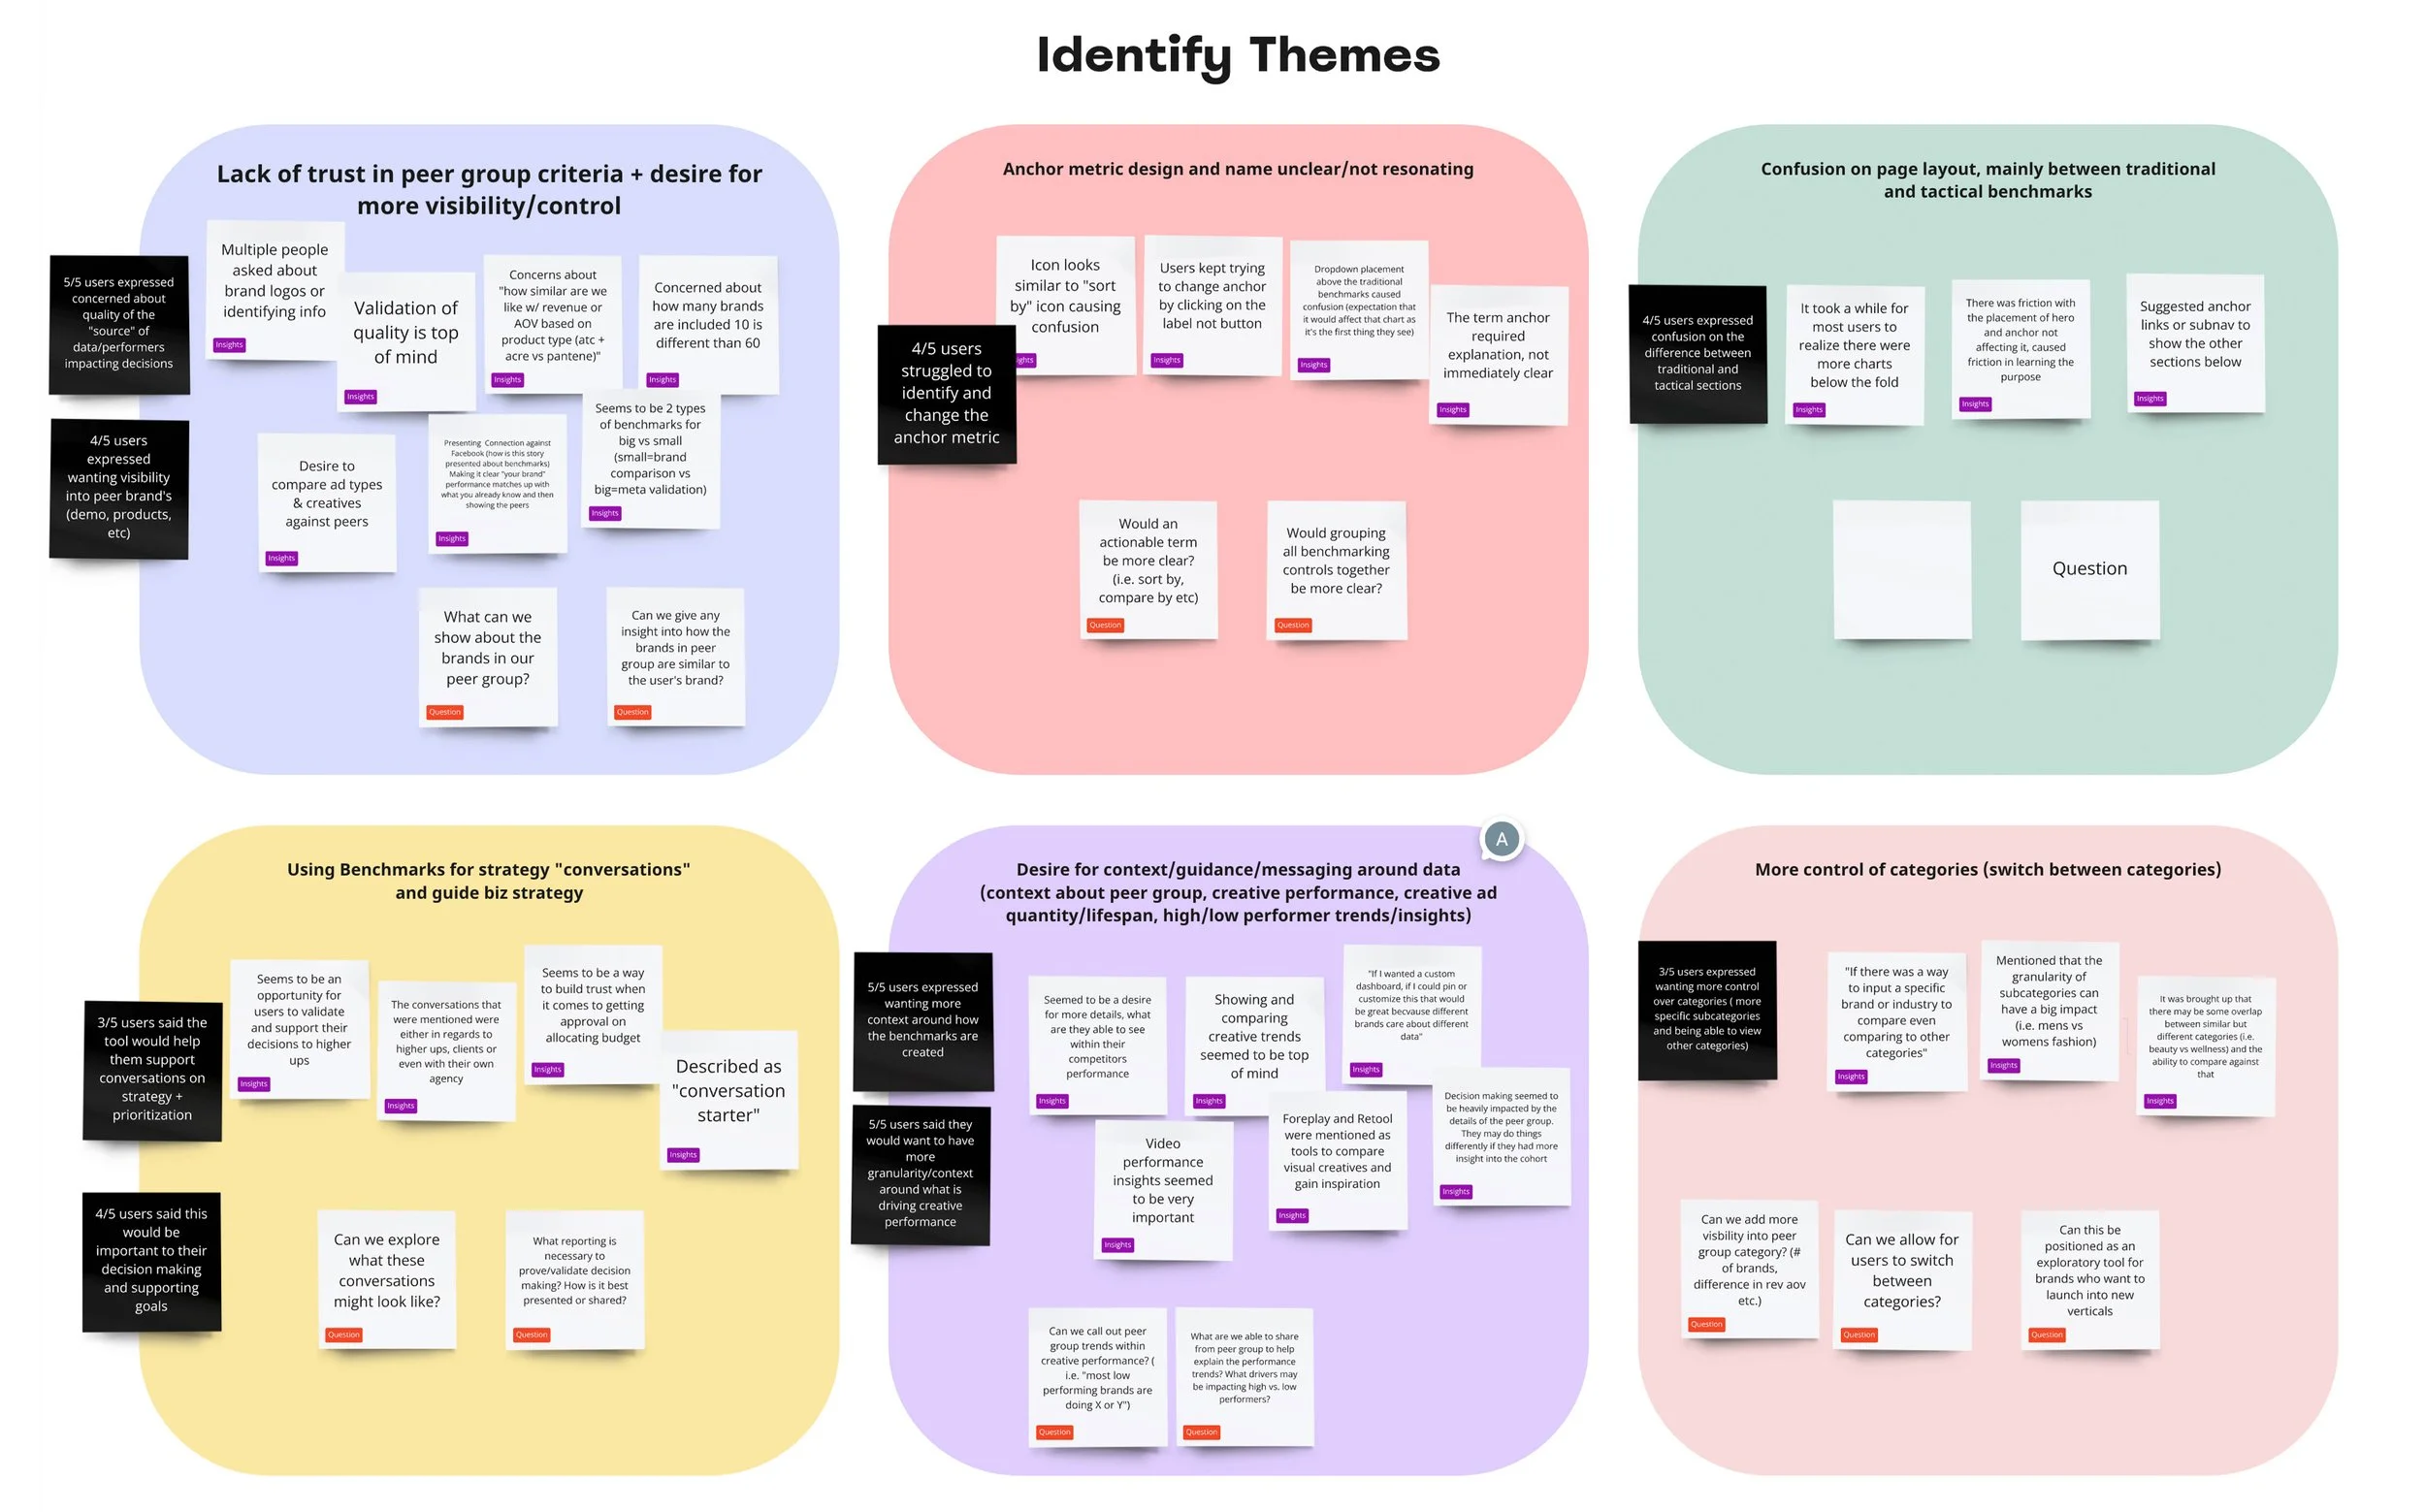
User Interview Results
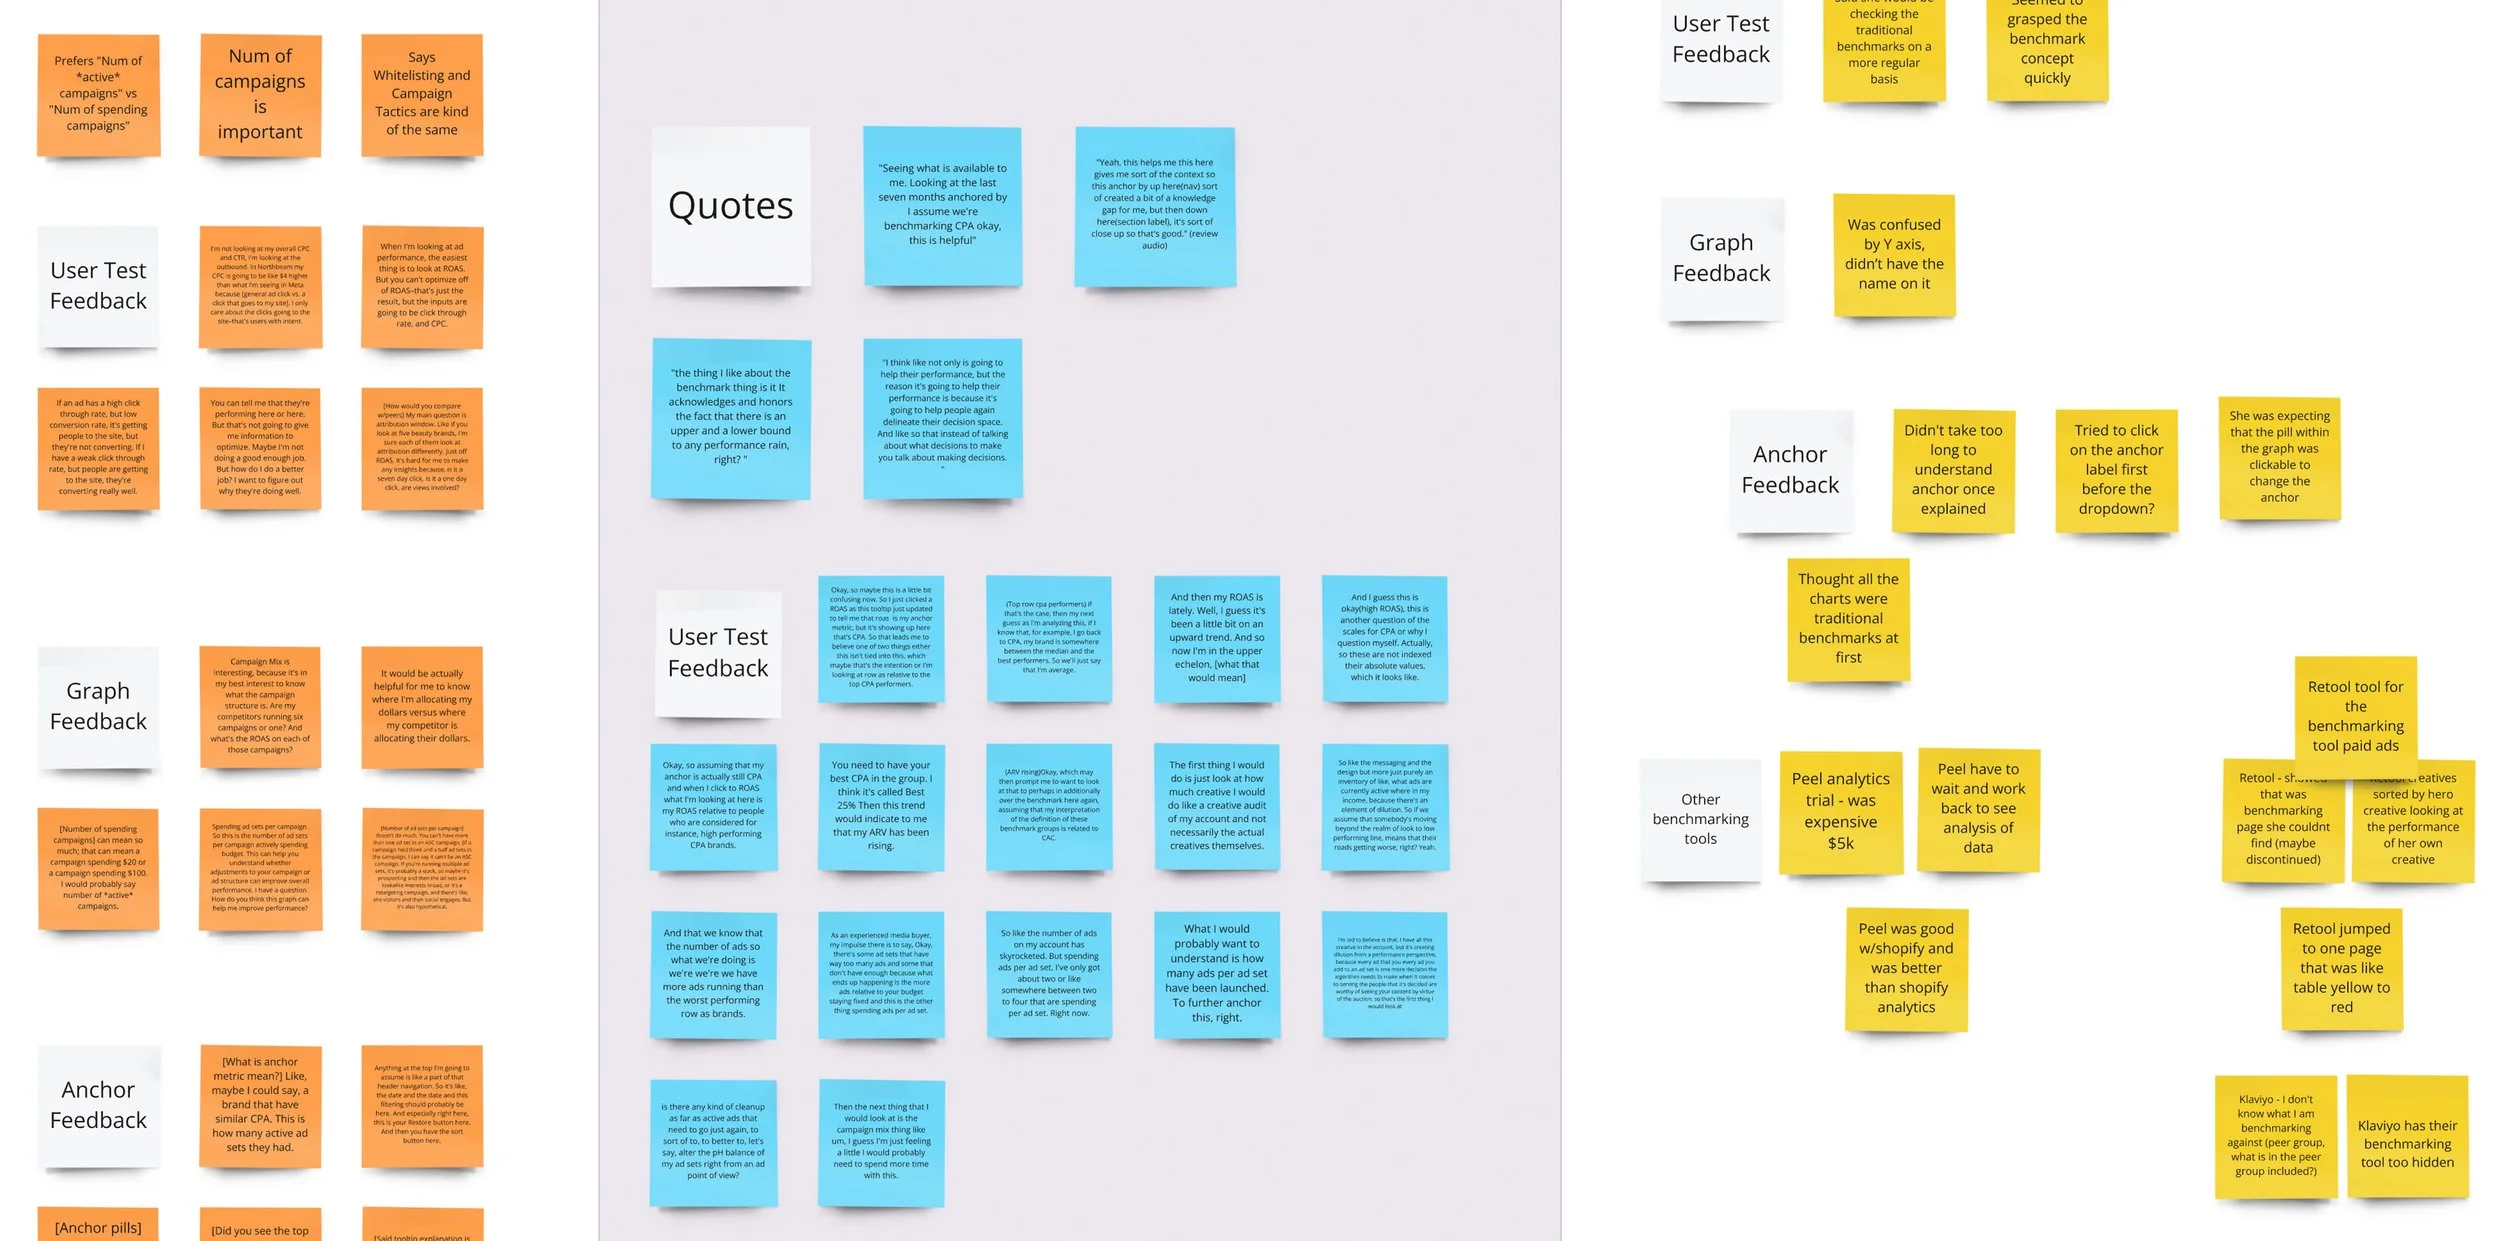
We conducted an affinity mapping exercise to identify key themes and pain points from user feedback.
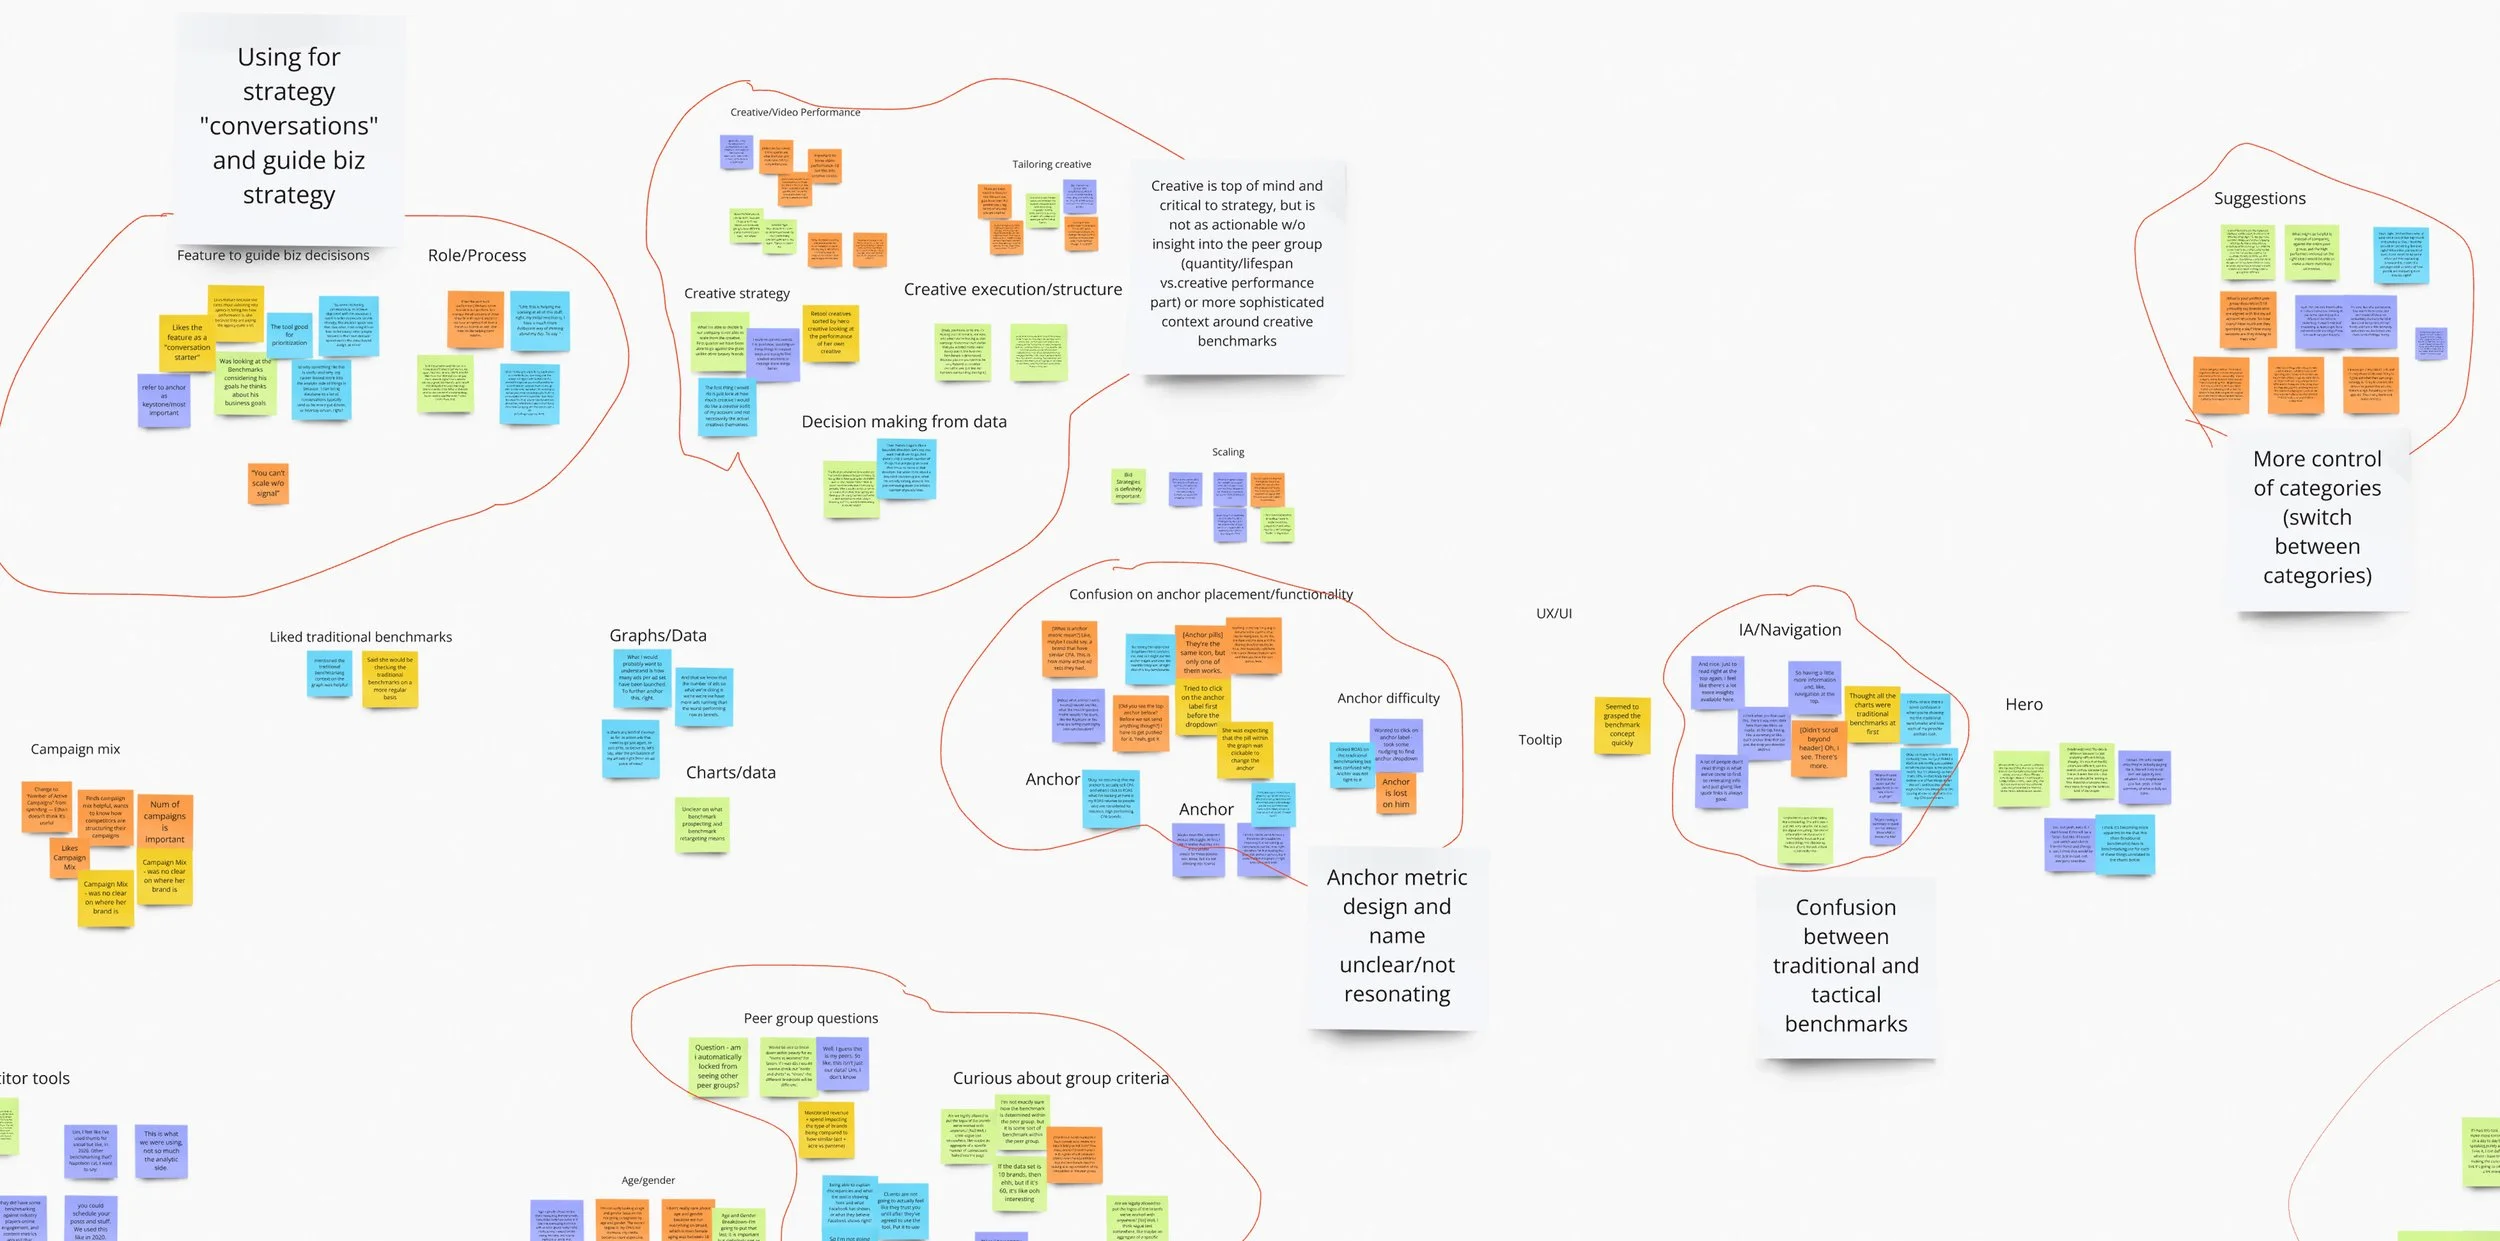
The Findings
Confusing page layout; Tactical Benchmarks needed clearer distinction from traditional benchmarks.
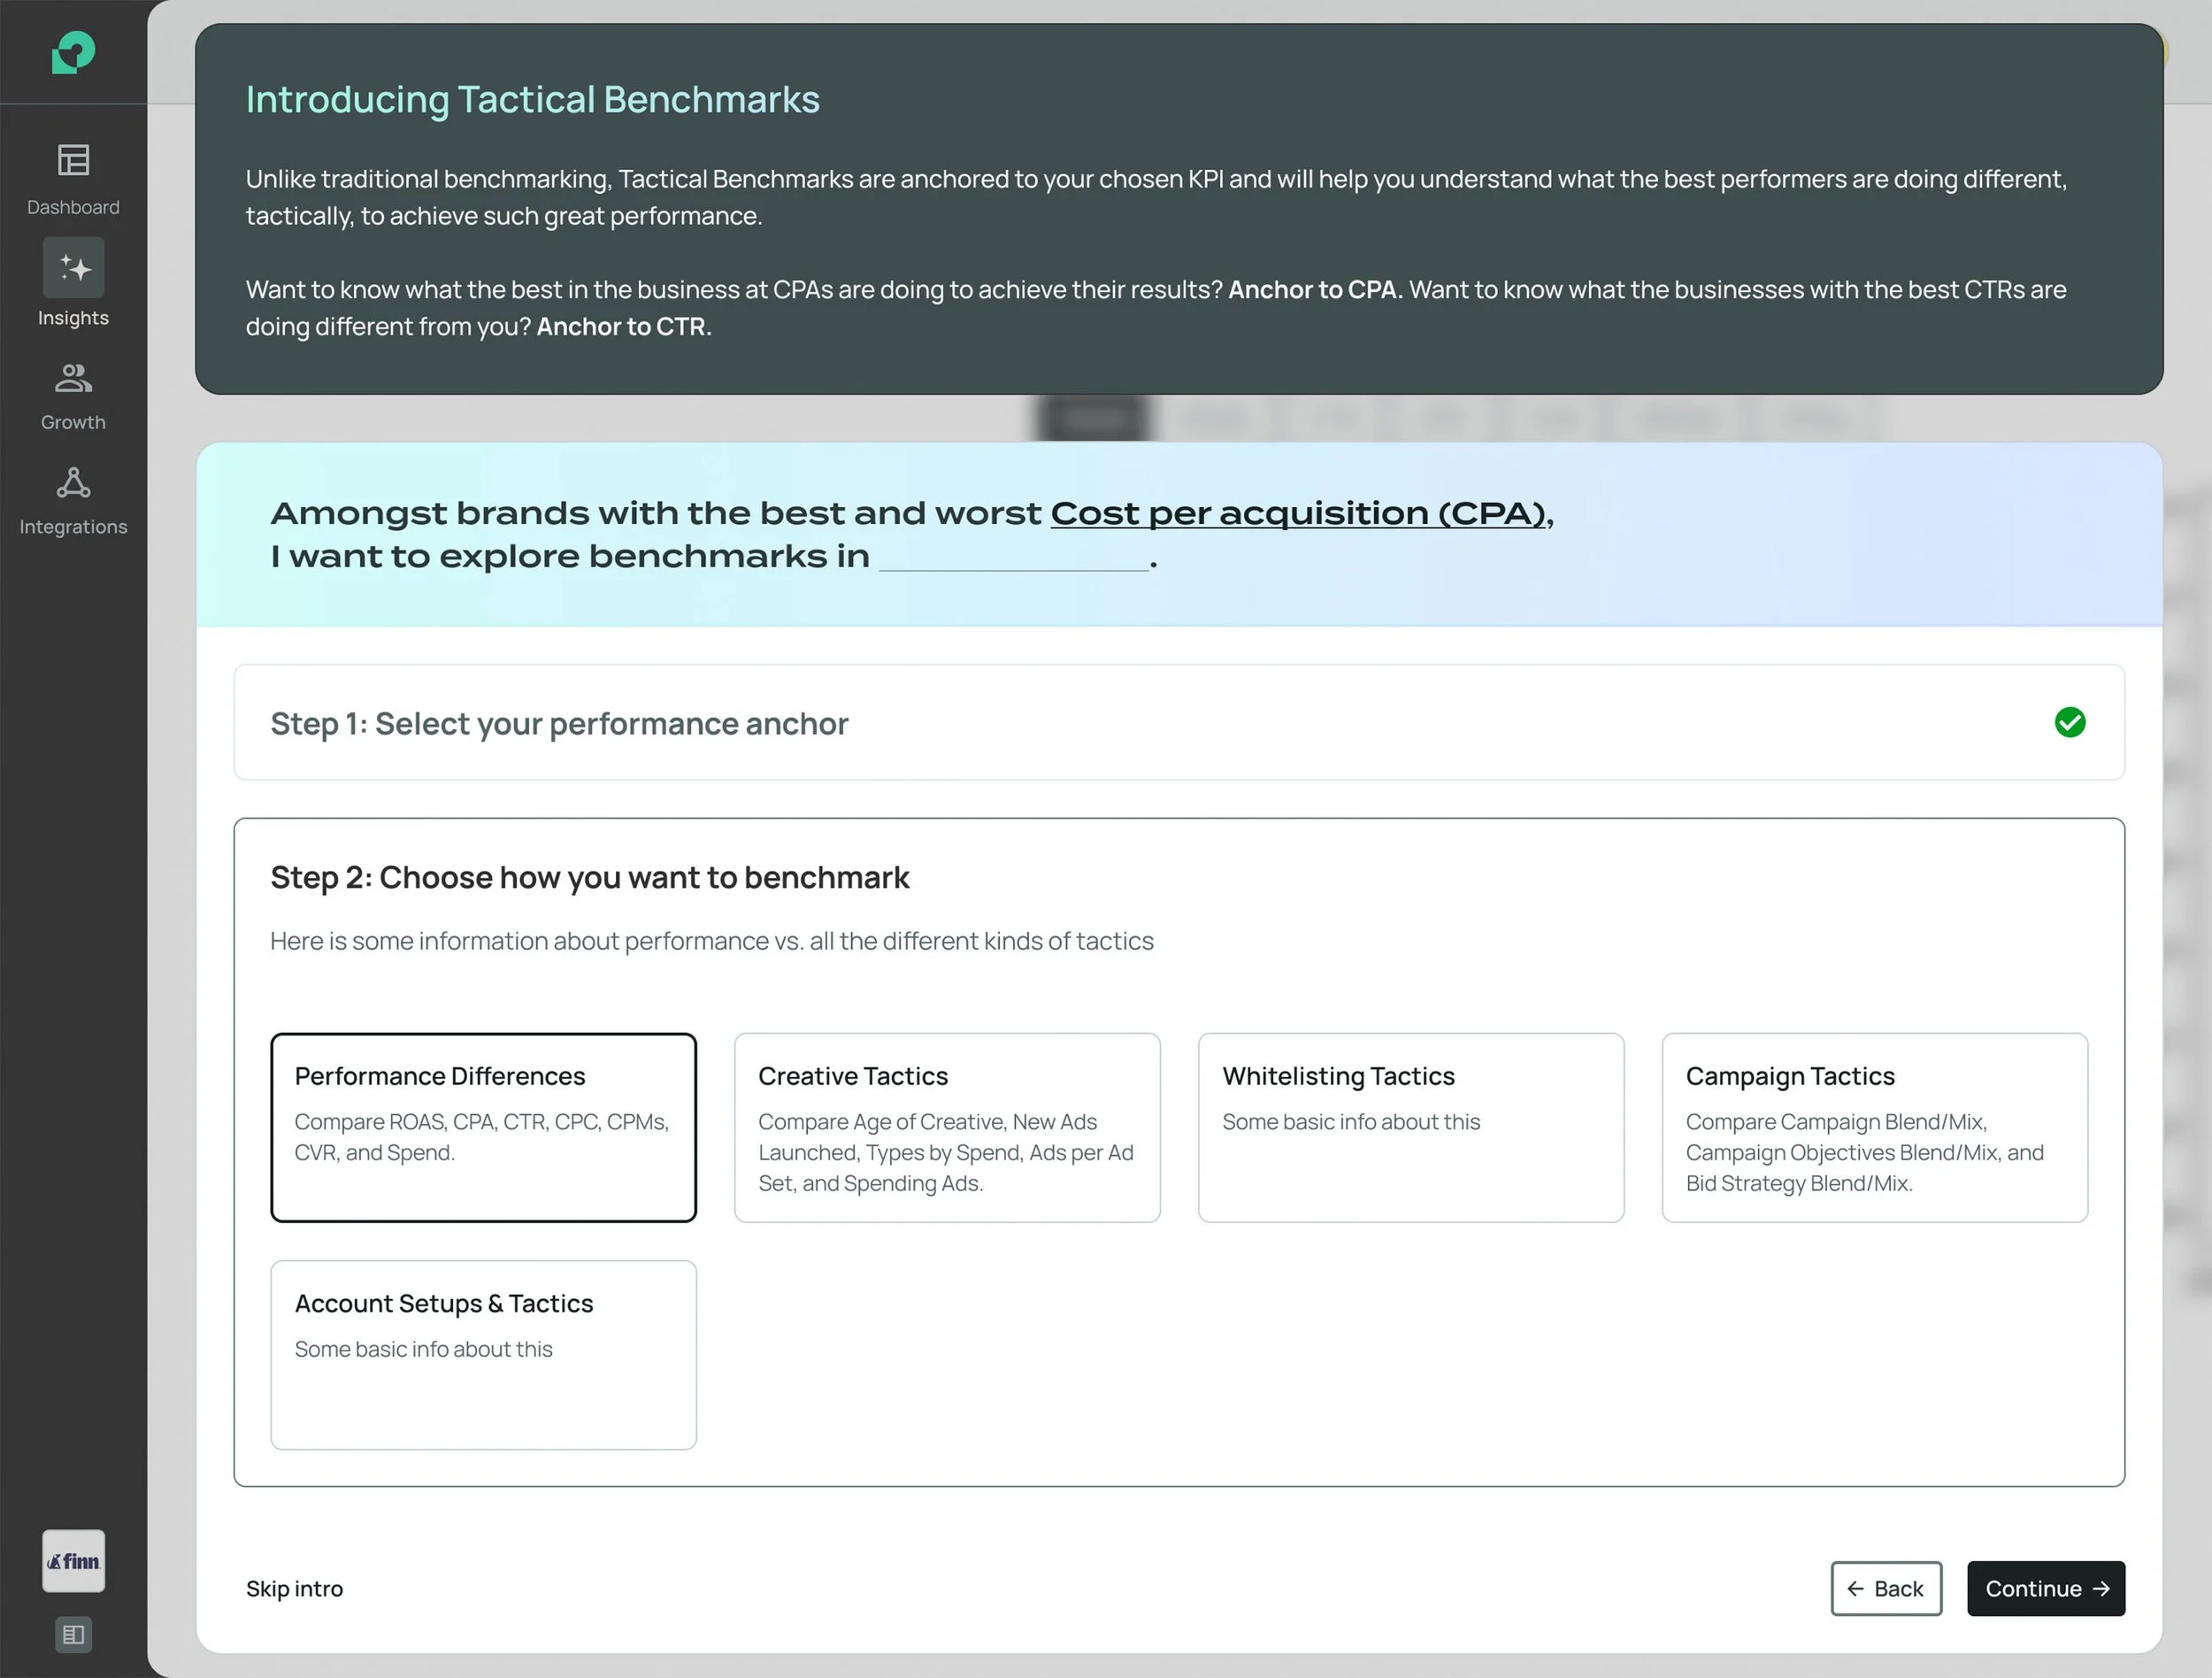
Lack of clarity on the Anchoring concept.
Need for improved navigation.
Anonymous peer group data reduced trust in benchmarking accuracy.
Desire for greater control over peer groups (e.g., category specificity).
Frustration with existing insights tools; need for analytics related to creative strategy.
Opportunities
Using a “How might we…” approach, we framed pain points into opportunities:
Redesign the layout and improve navigation.
Clarify the Anchoring concept through UX refinements and onboarding.
Increase flexibility and control over peer group data (e.g., deeper categories).
Explore new insights tools to support creative strategy decisions.
MVP Release
With foundational design and development complete, the MVP version of Tactical Benchmarks was released internally on Nova—our internal version of the app—allowing customer success and sales teams to use it without relying on data analysts.
User testing insights led to refinement opportunities, while some findings sparked the concept for Performance Trends, another insights tool. The groundwork in data visualization and backend systems enabled rapid development—but that’s a case study for another time.
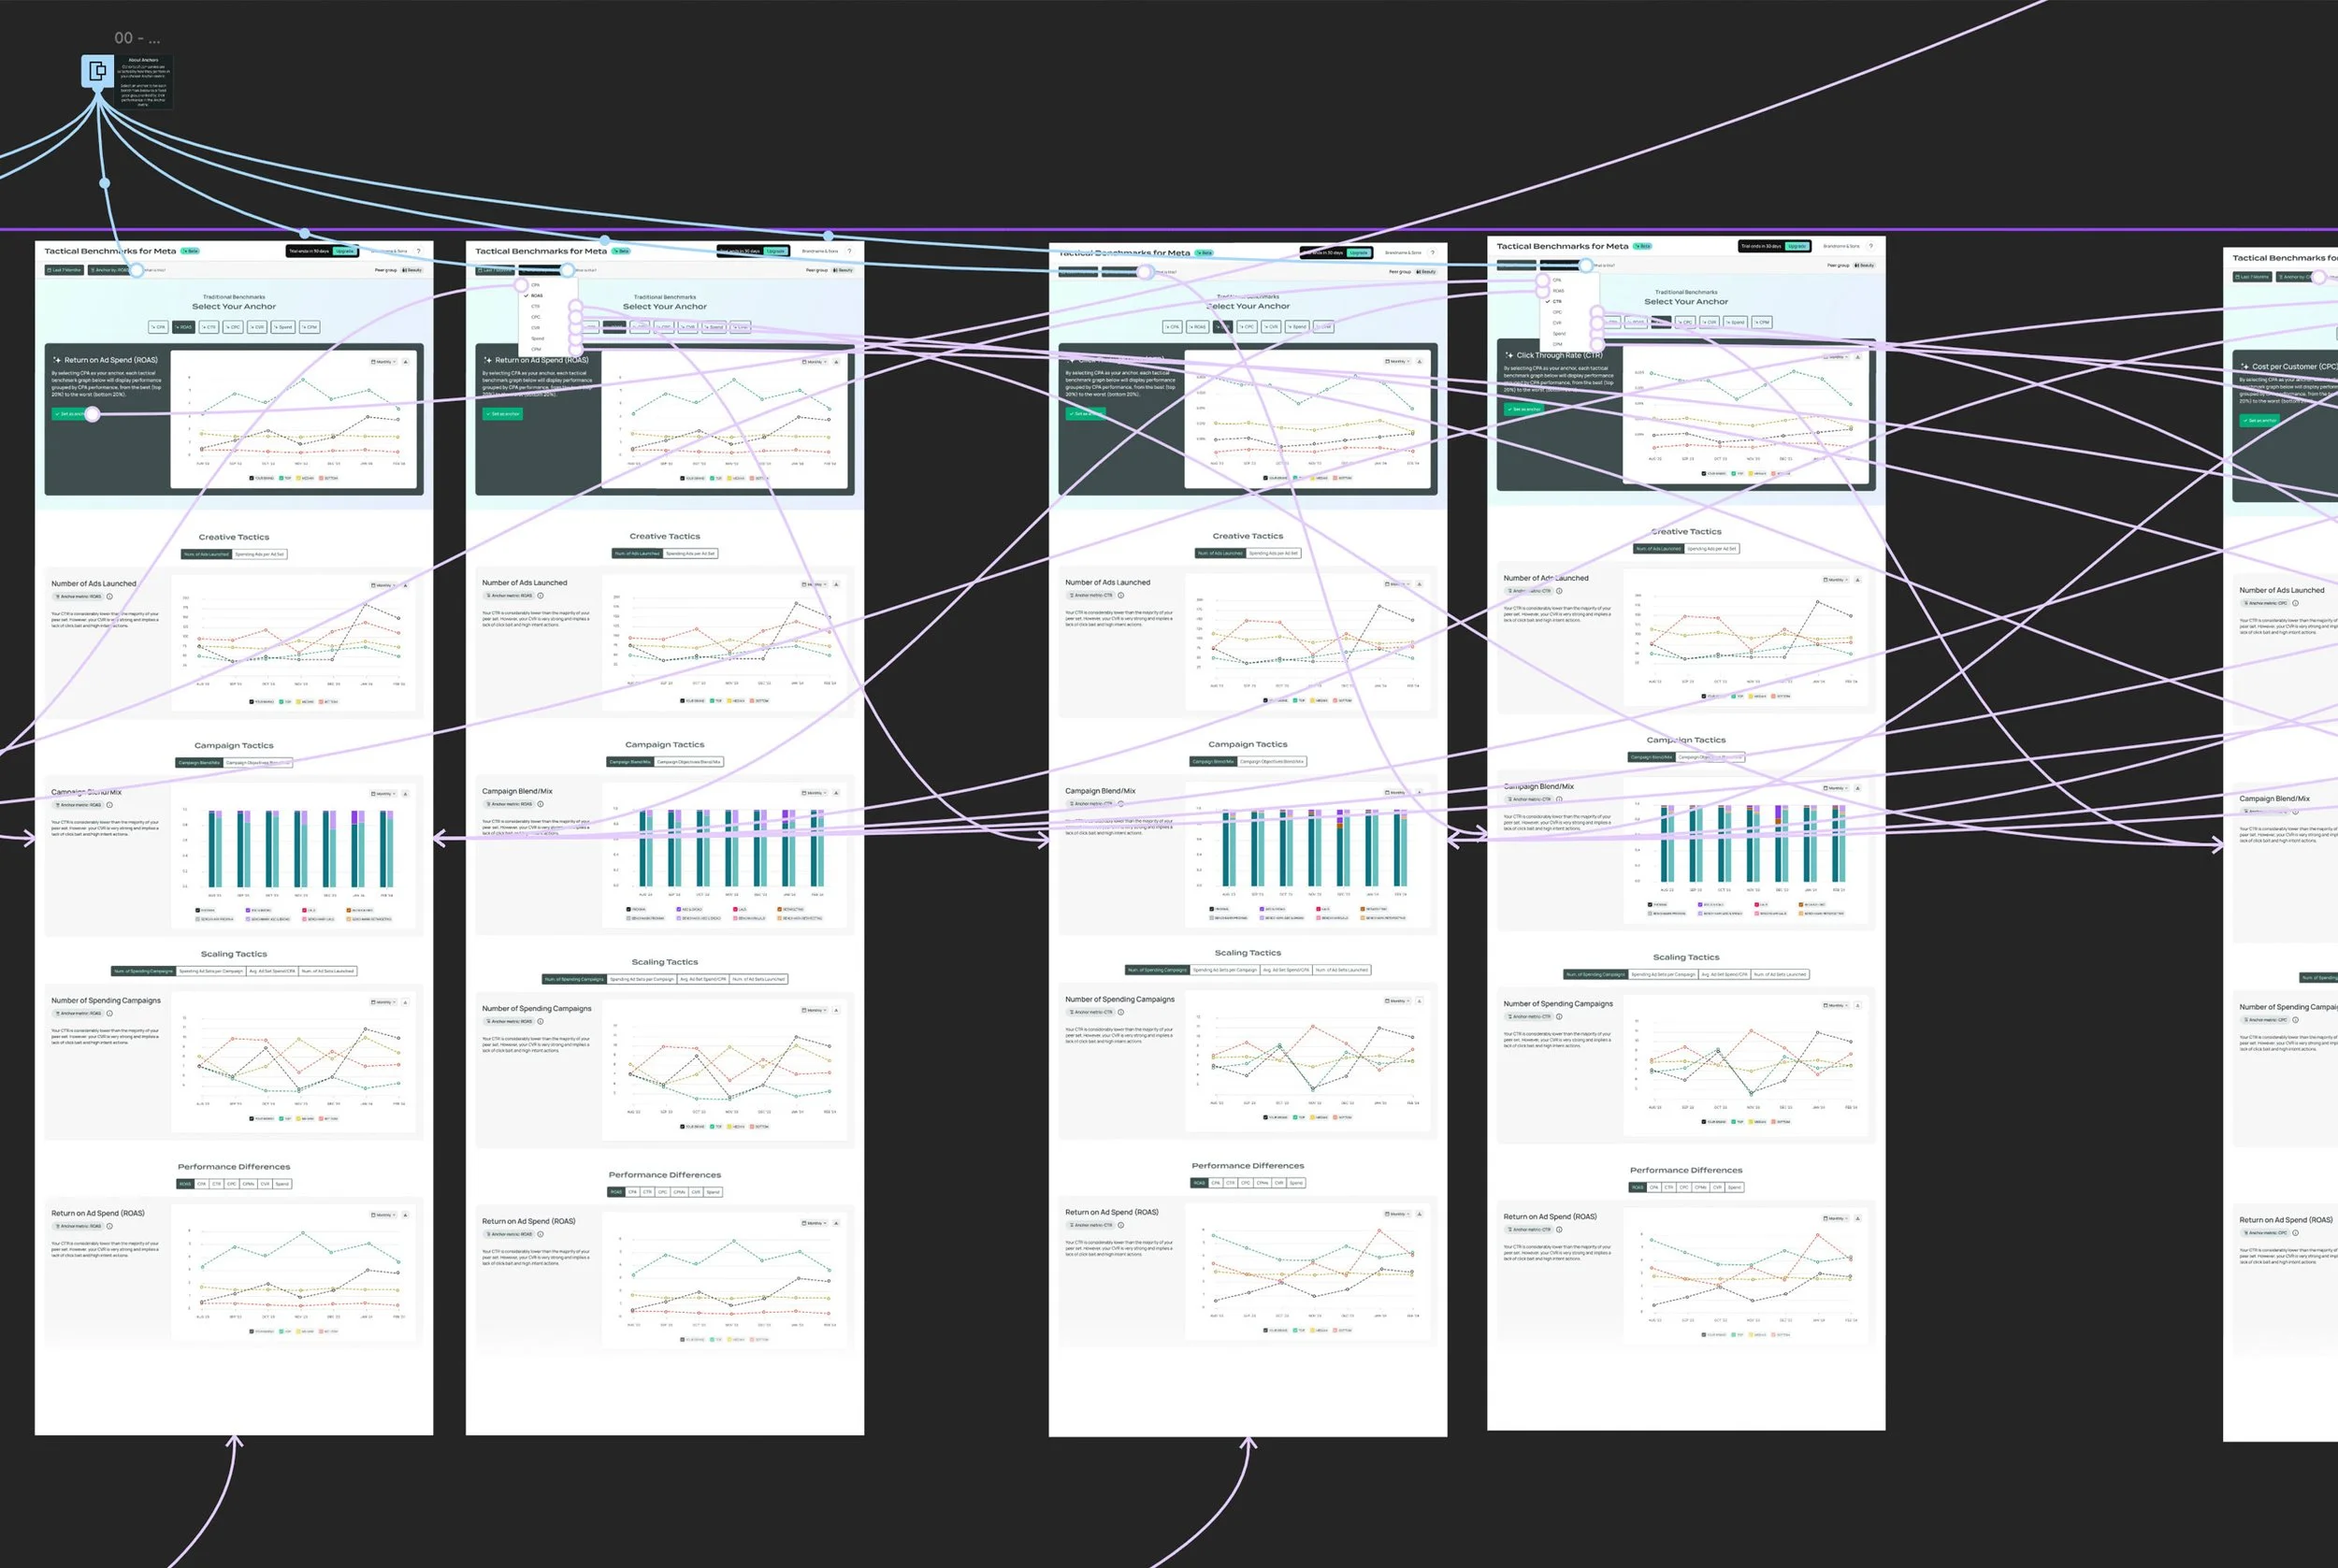
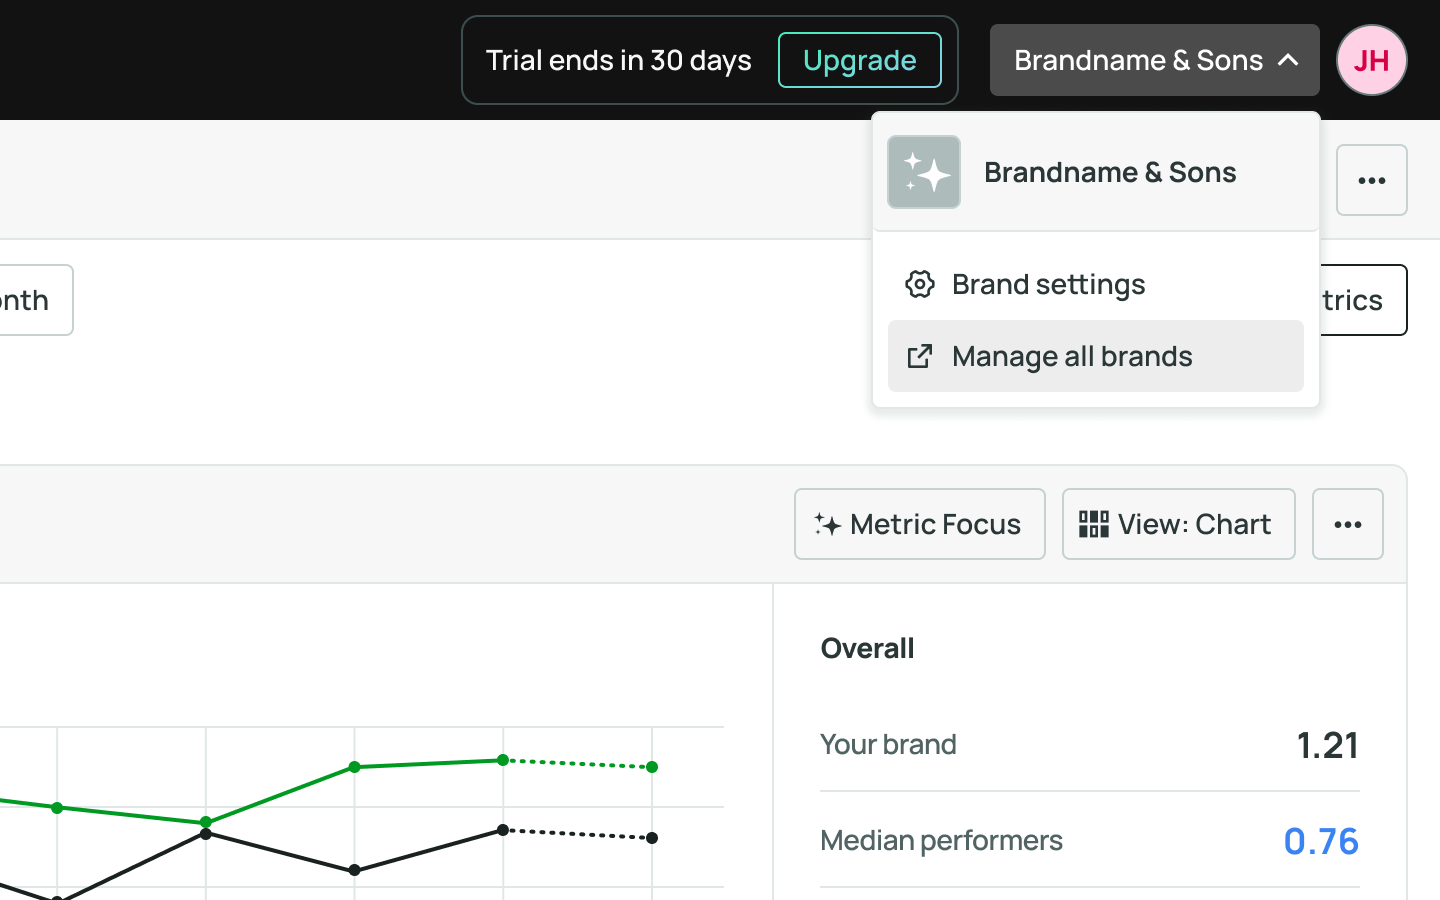
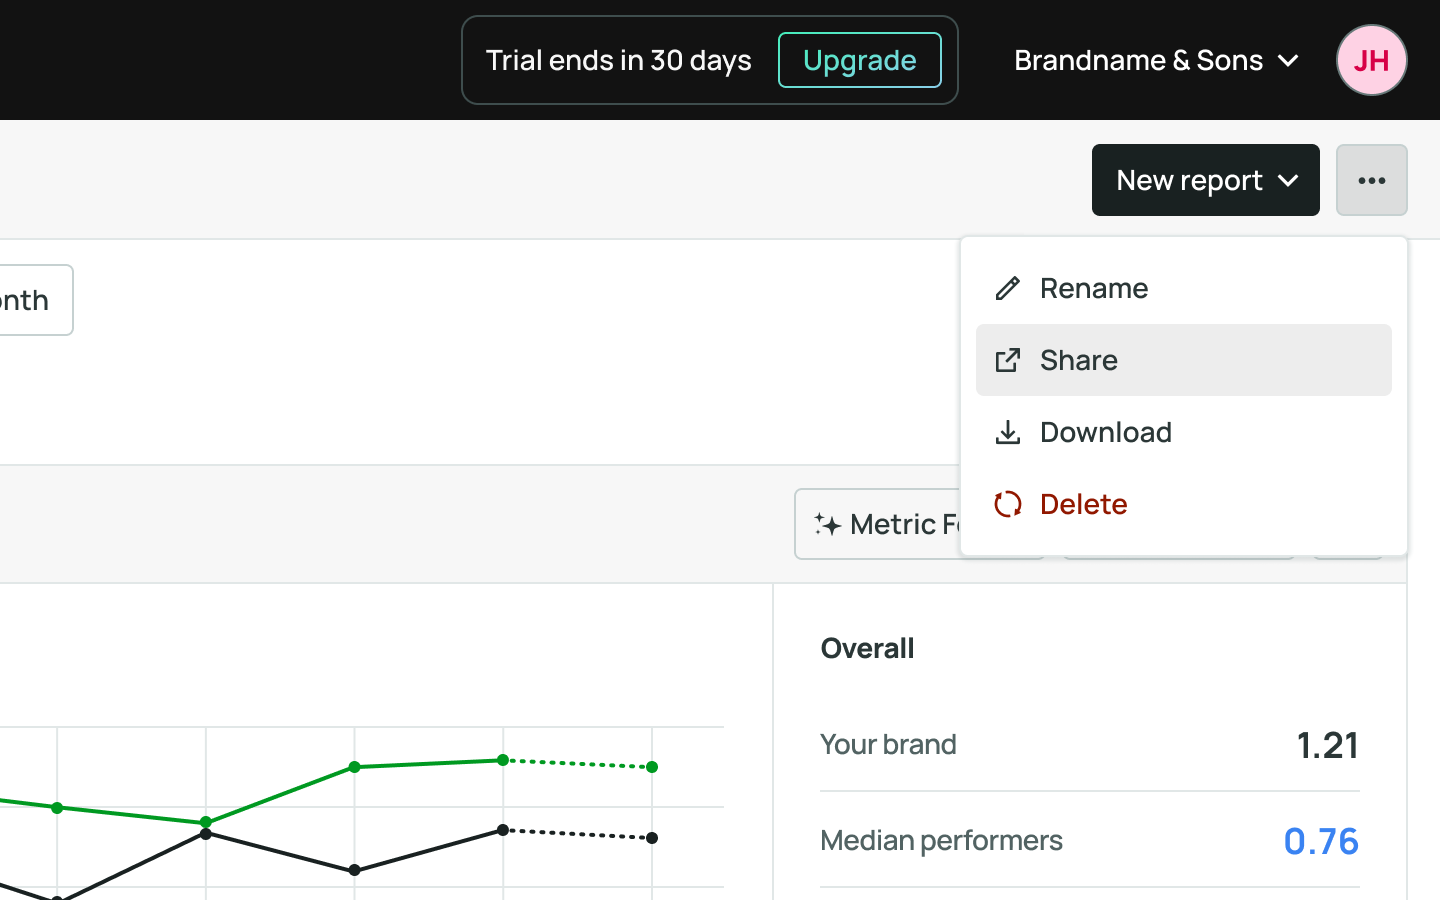
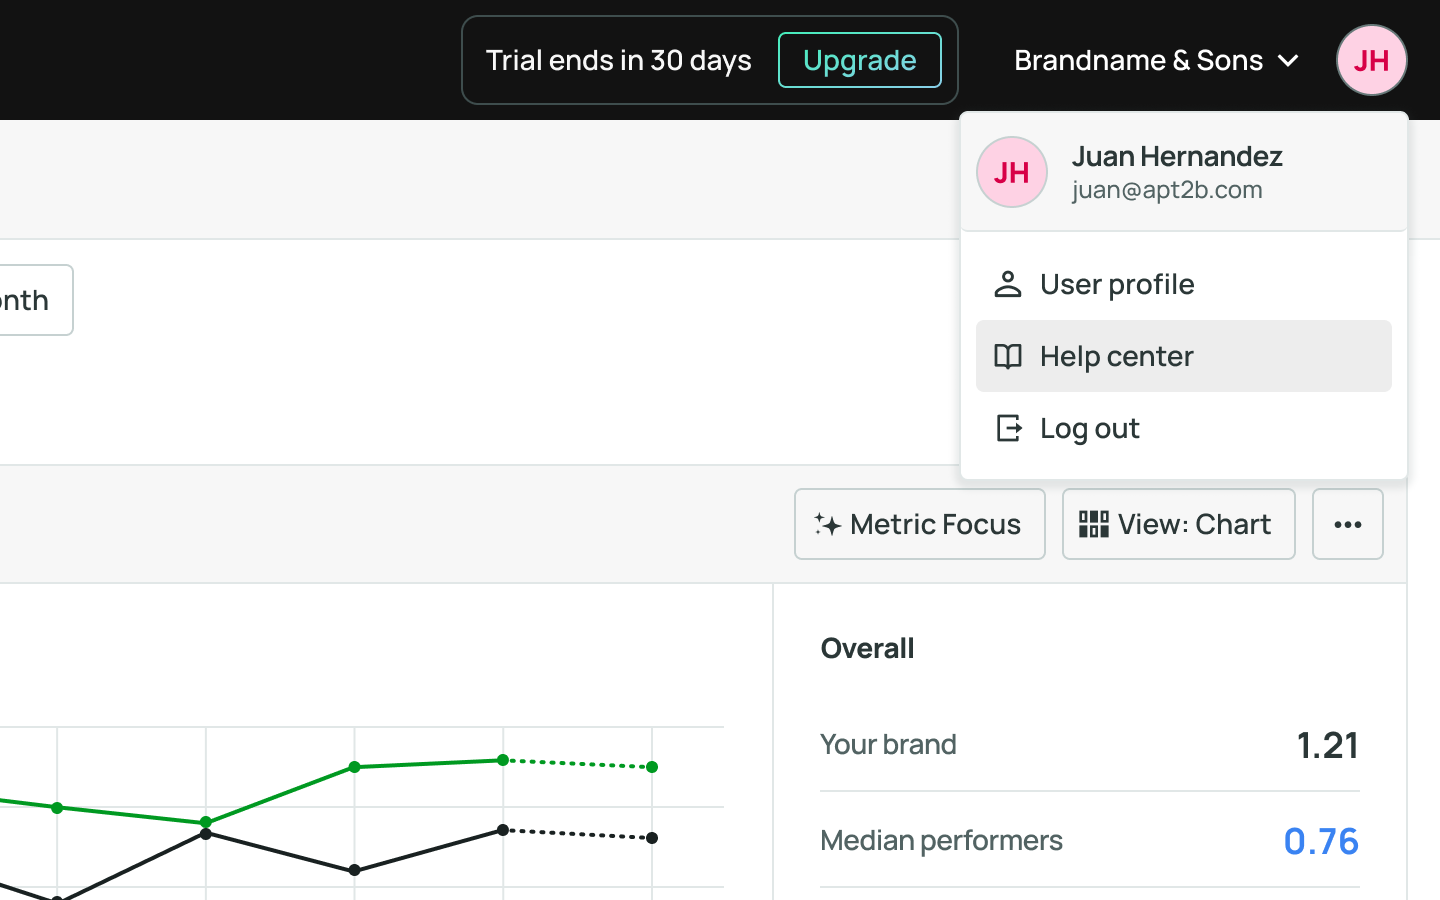
UI Component Updates
Header Bar – Before & After


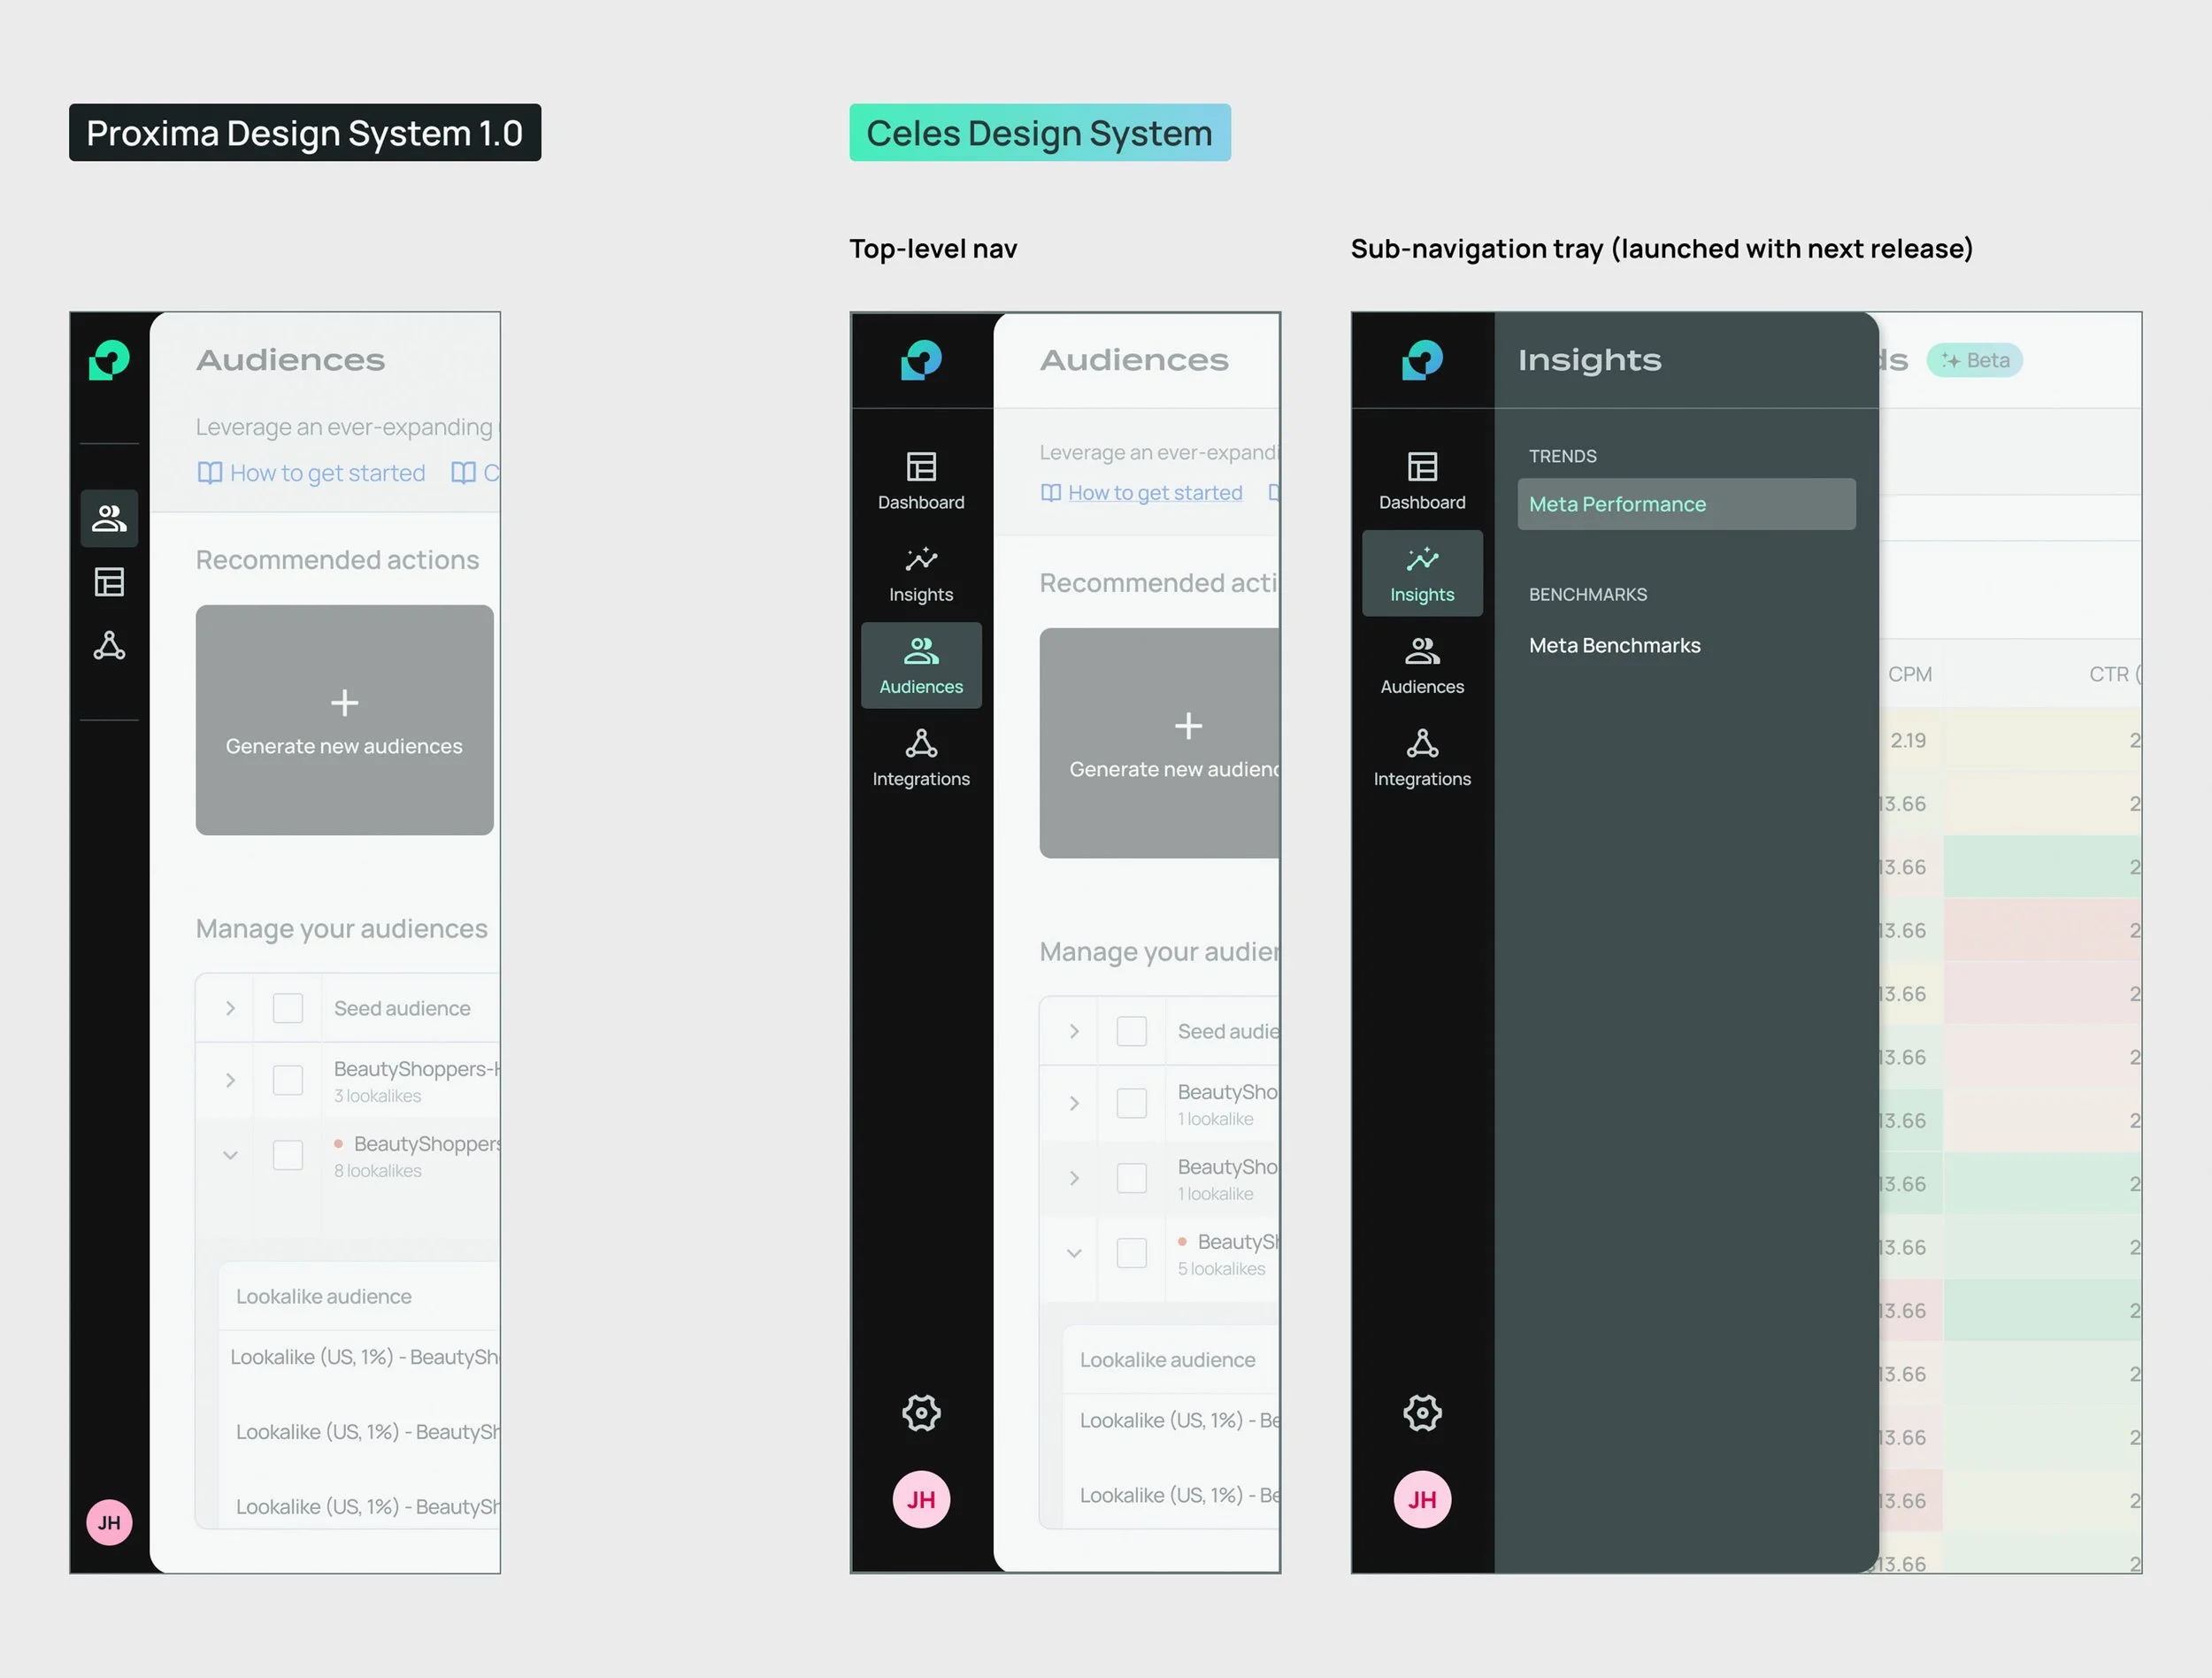
Top-level Navigation – Before & After

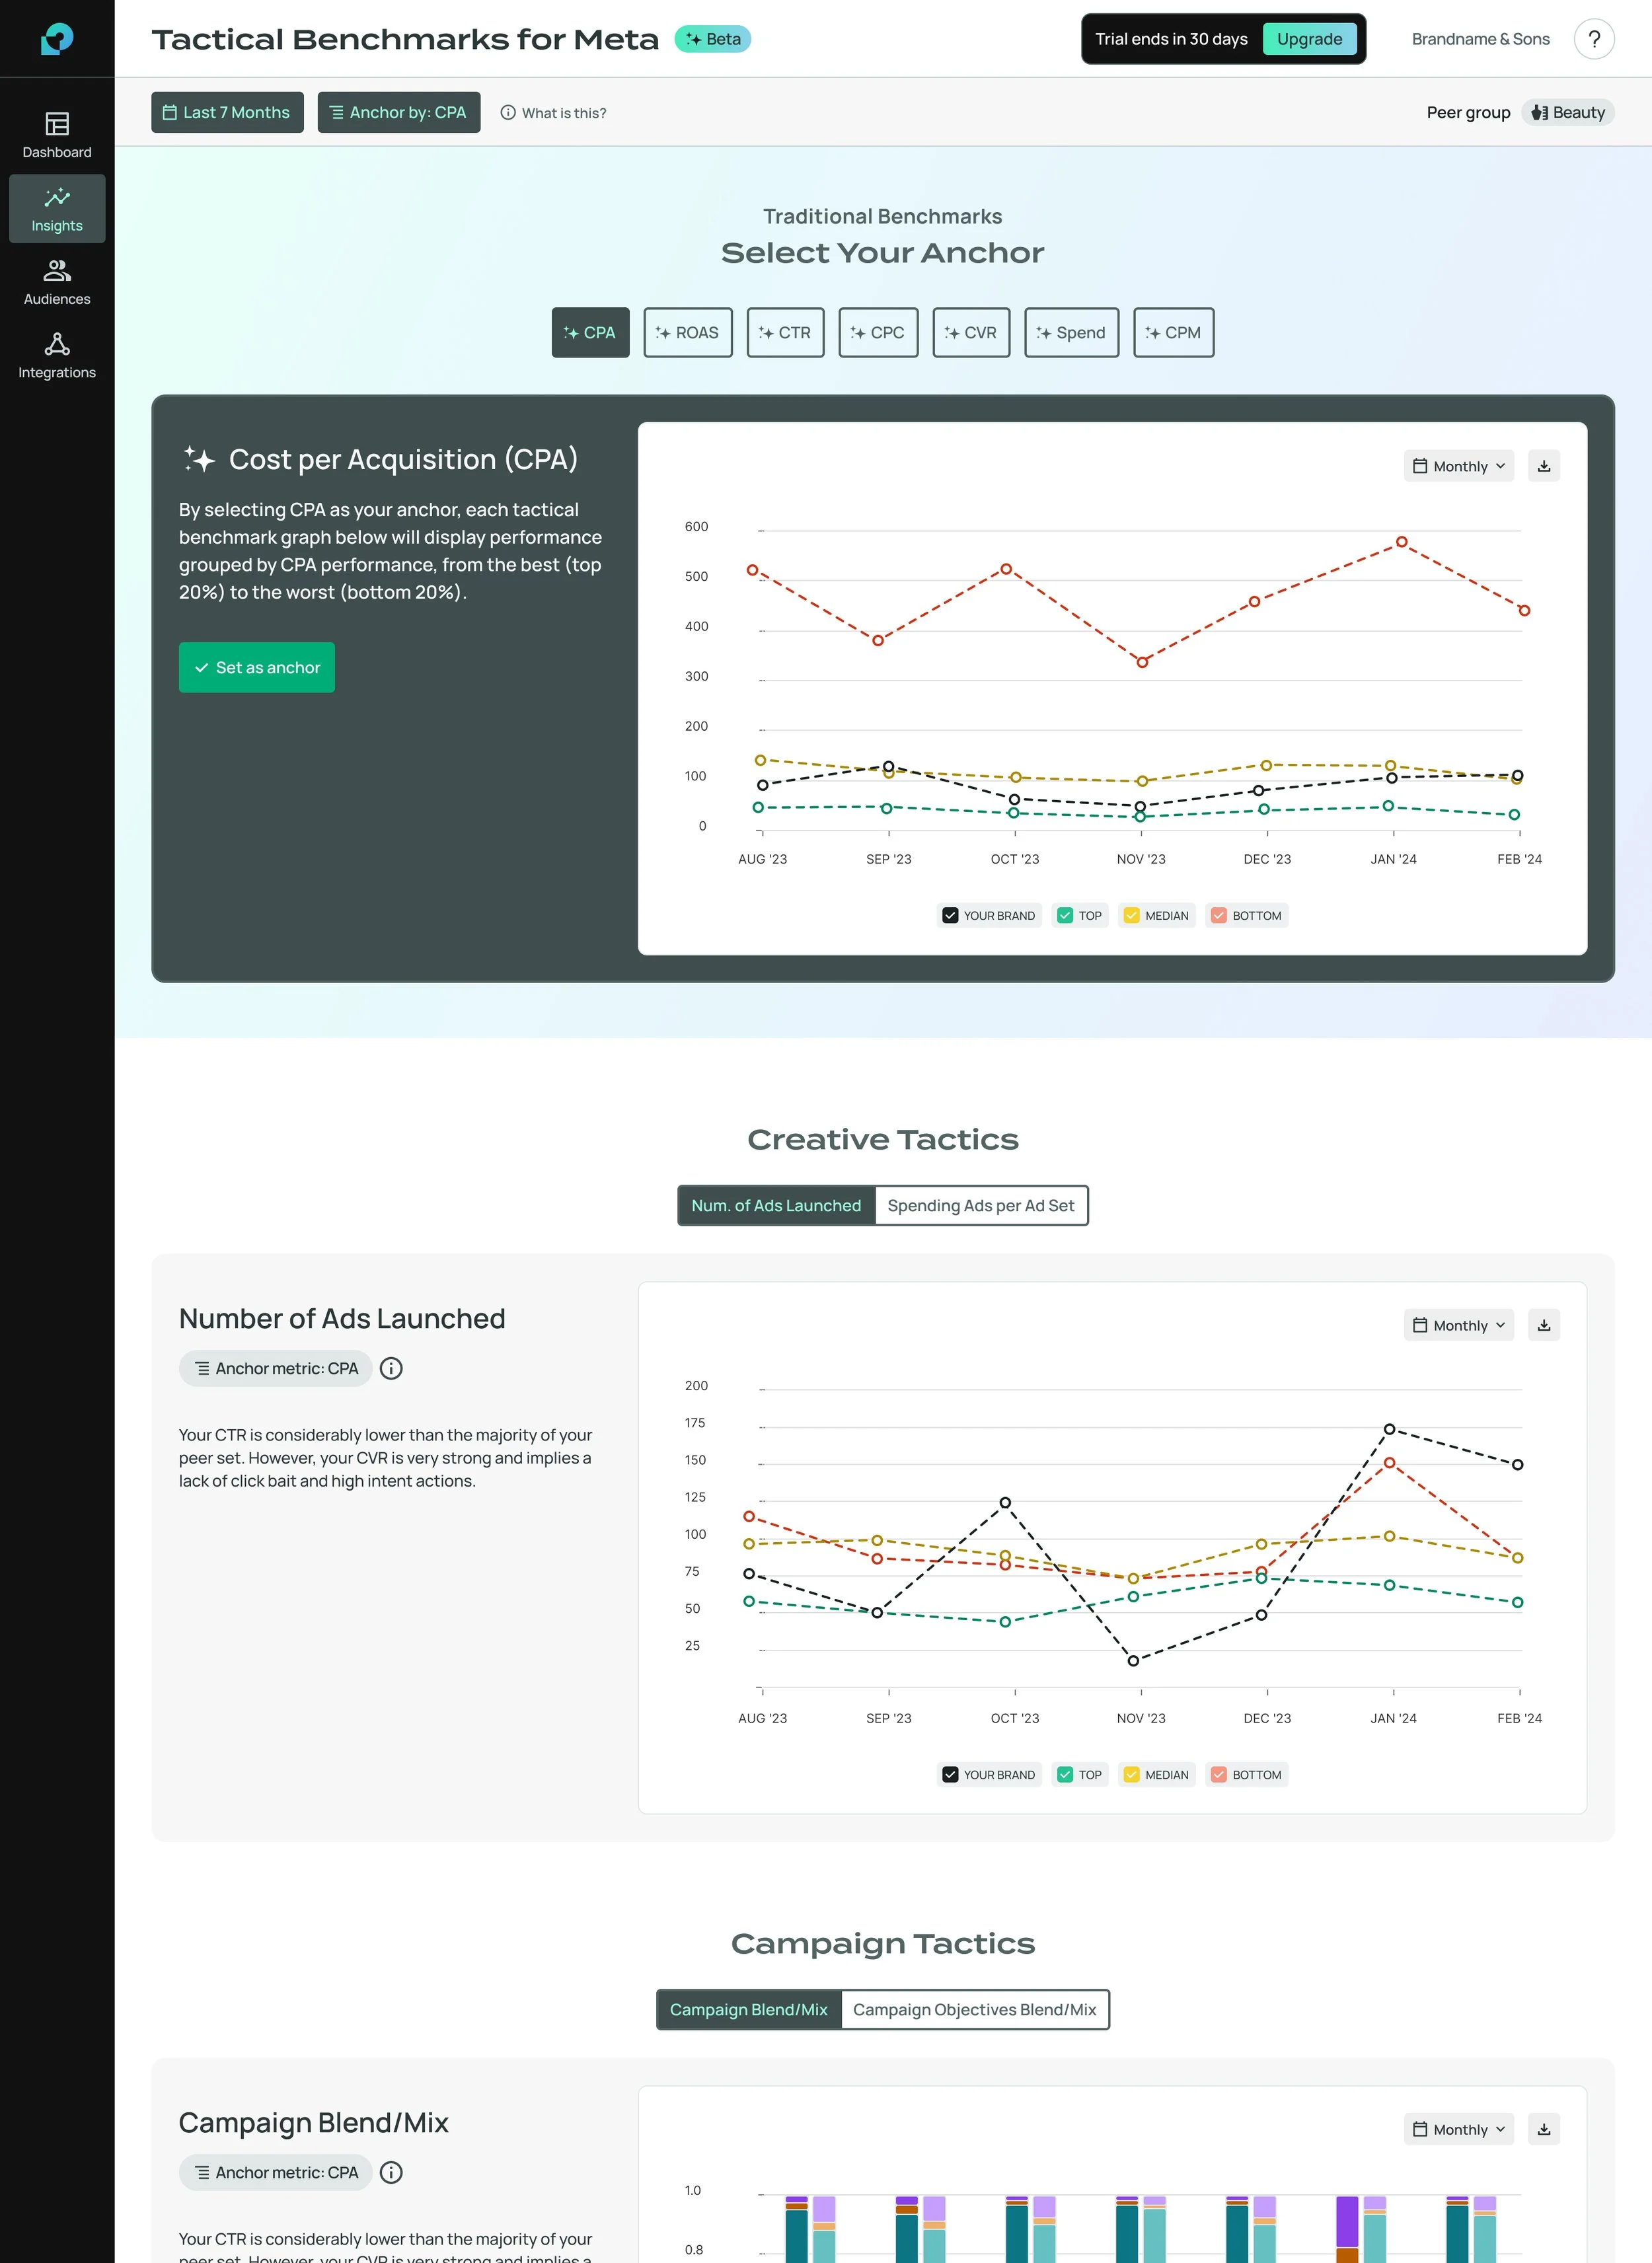
Final Designs
After launching Performance Trends, we focused on making Tactical Benchmarks consumer-ready by implementing previously identified solutions.
Note: I left Proxima during this development phase. These designs represent the intended vision I helped create with our lead designer. As development occurred in phases, some features may not be live yet.
Key Improvements
Replaced the confusing MVP layout with a singular, consistent chart module instead of stacking traditional and tactical benchmarks
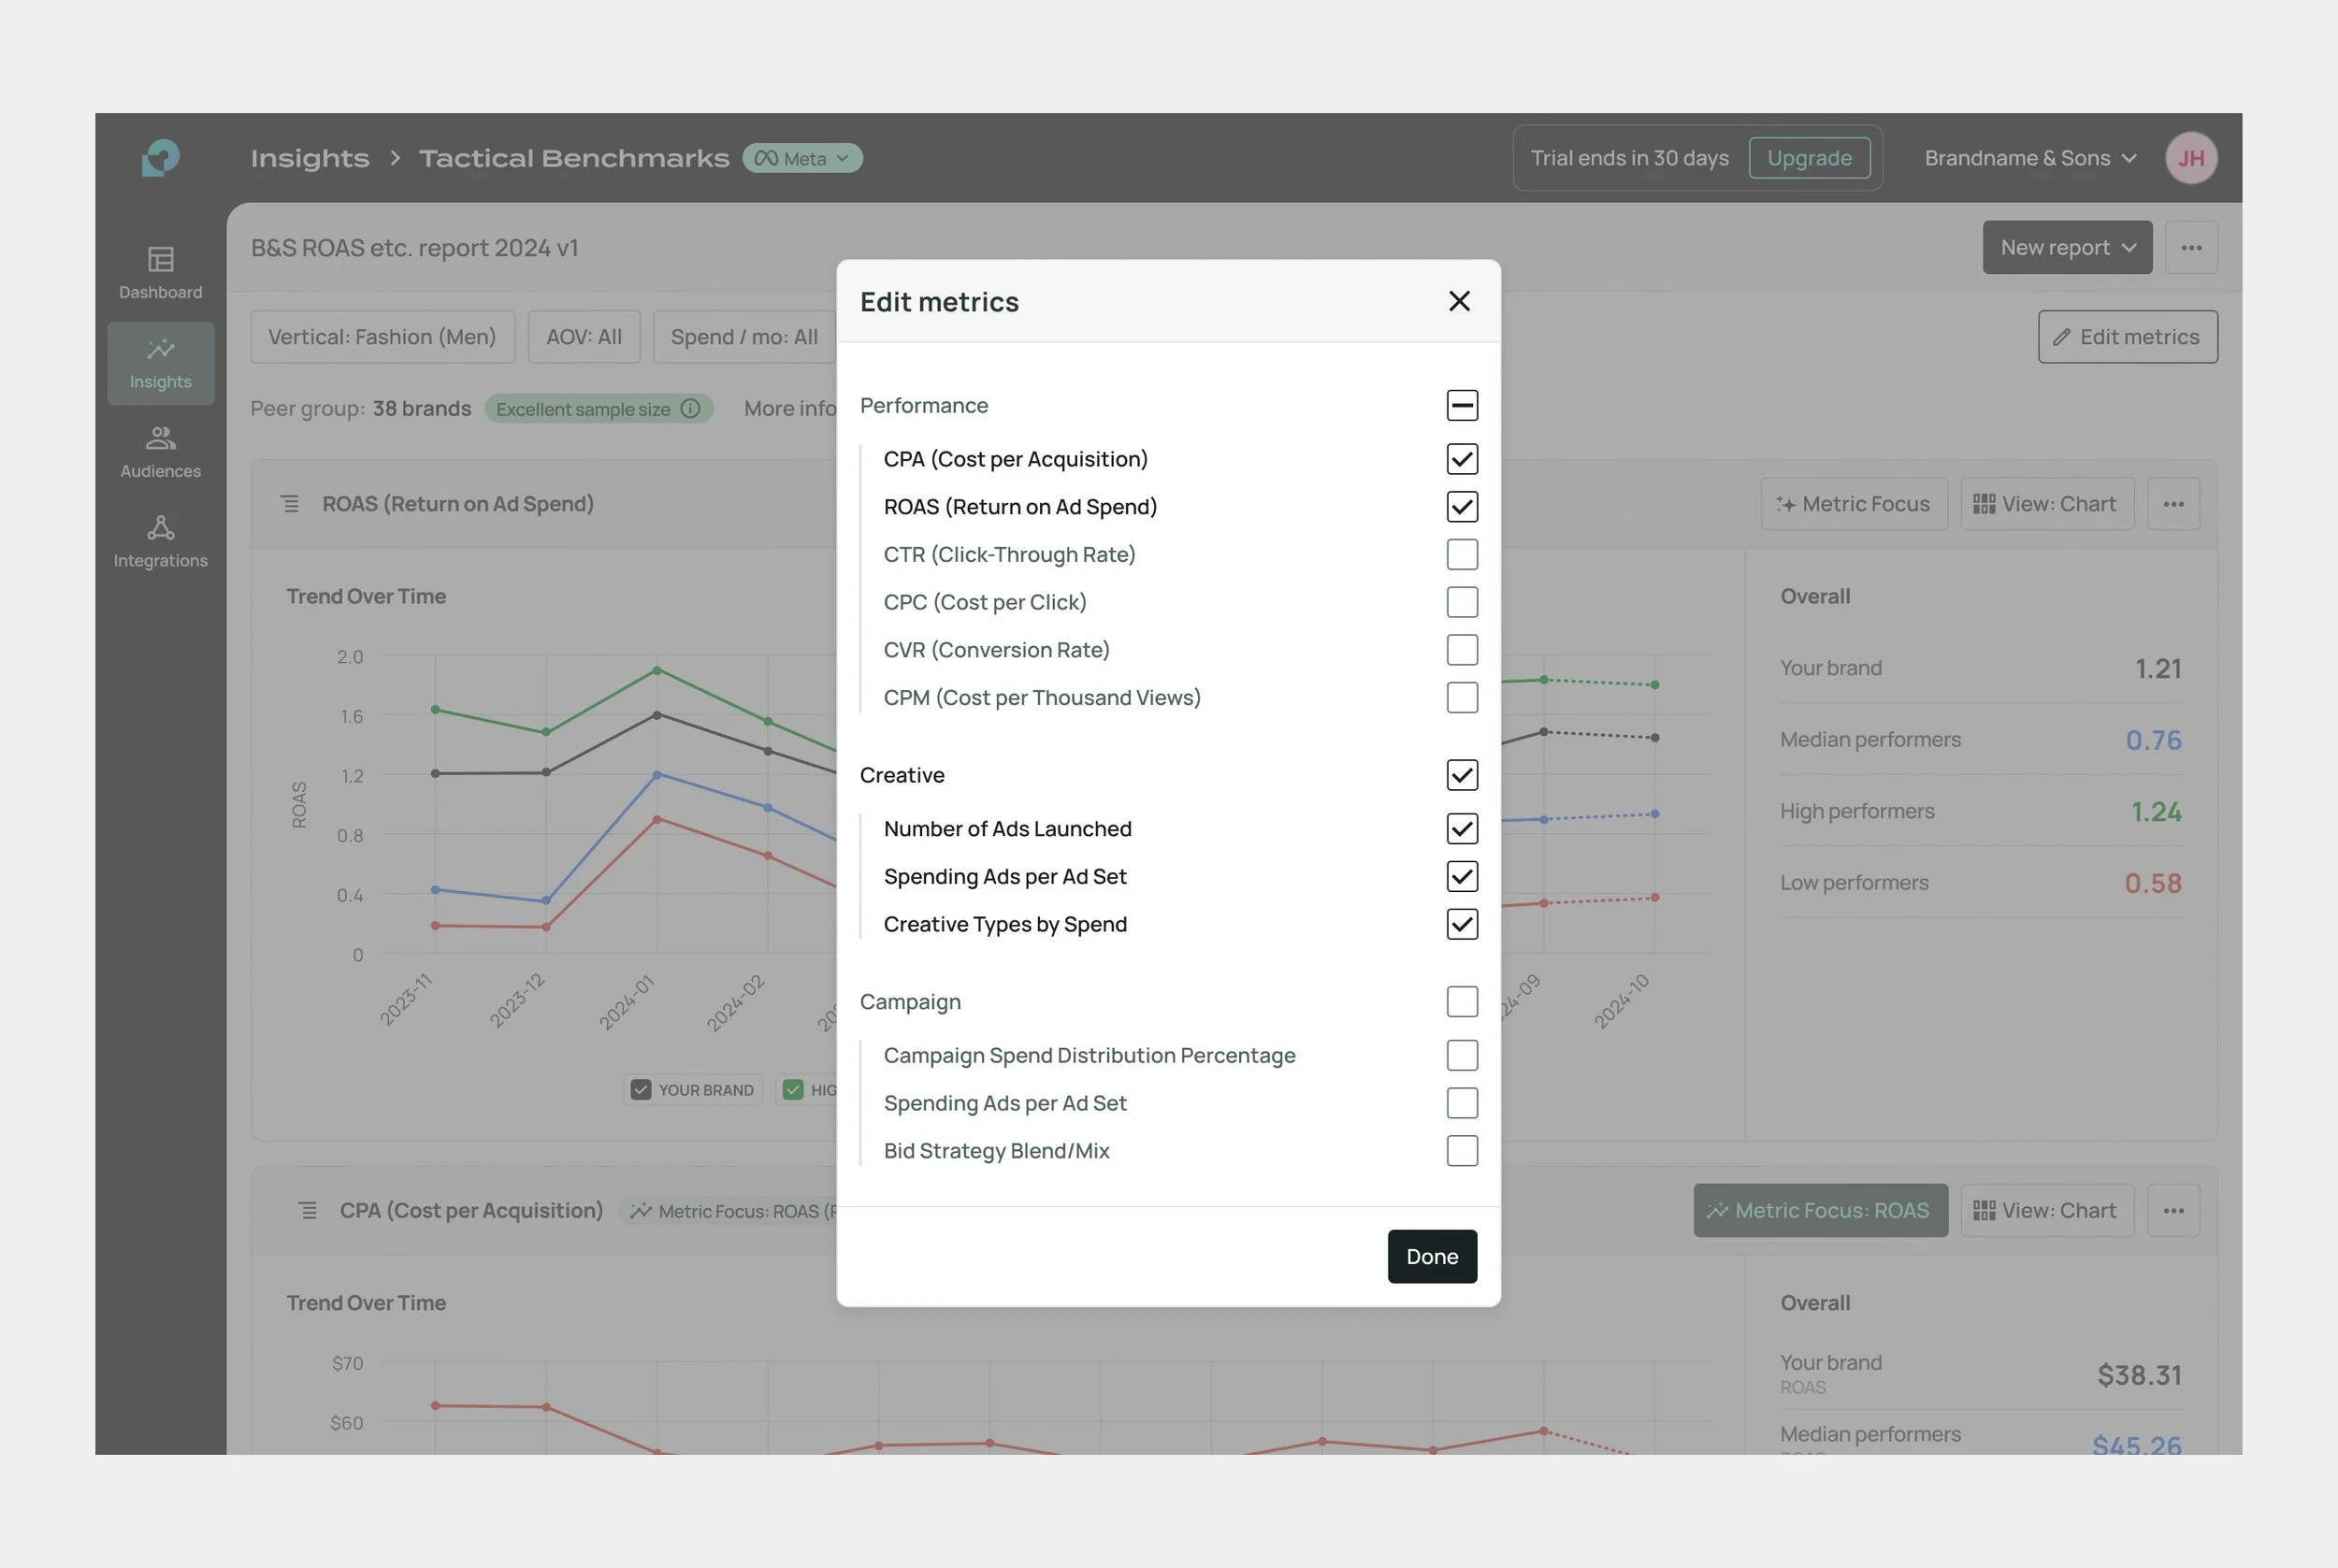
Enabled users to select specific metrics for reports rather than defaulting to benchmark categories
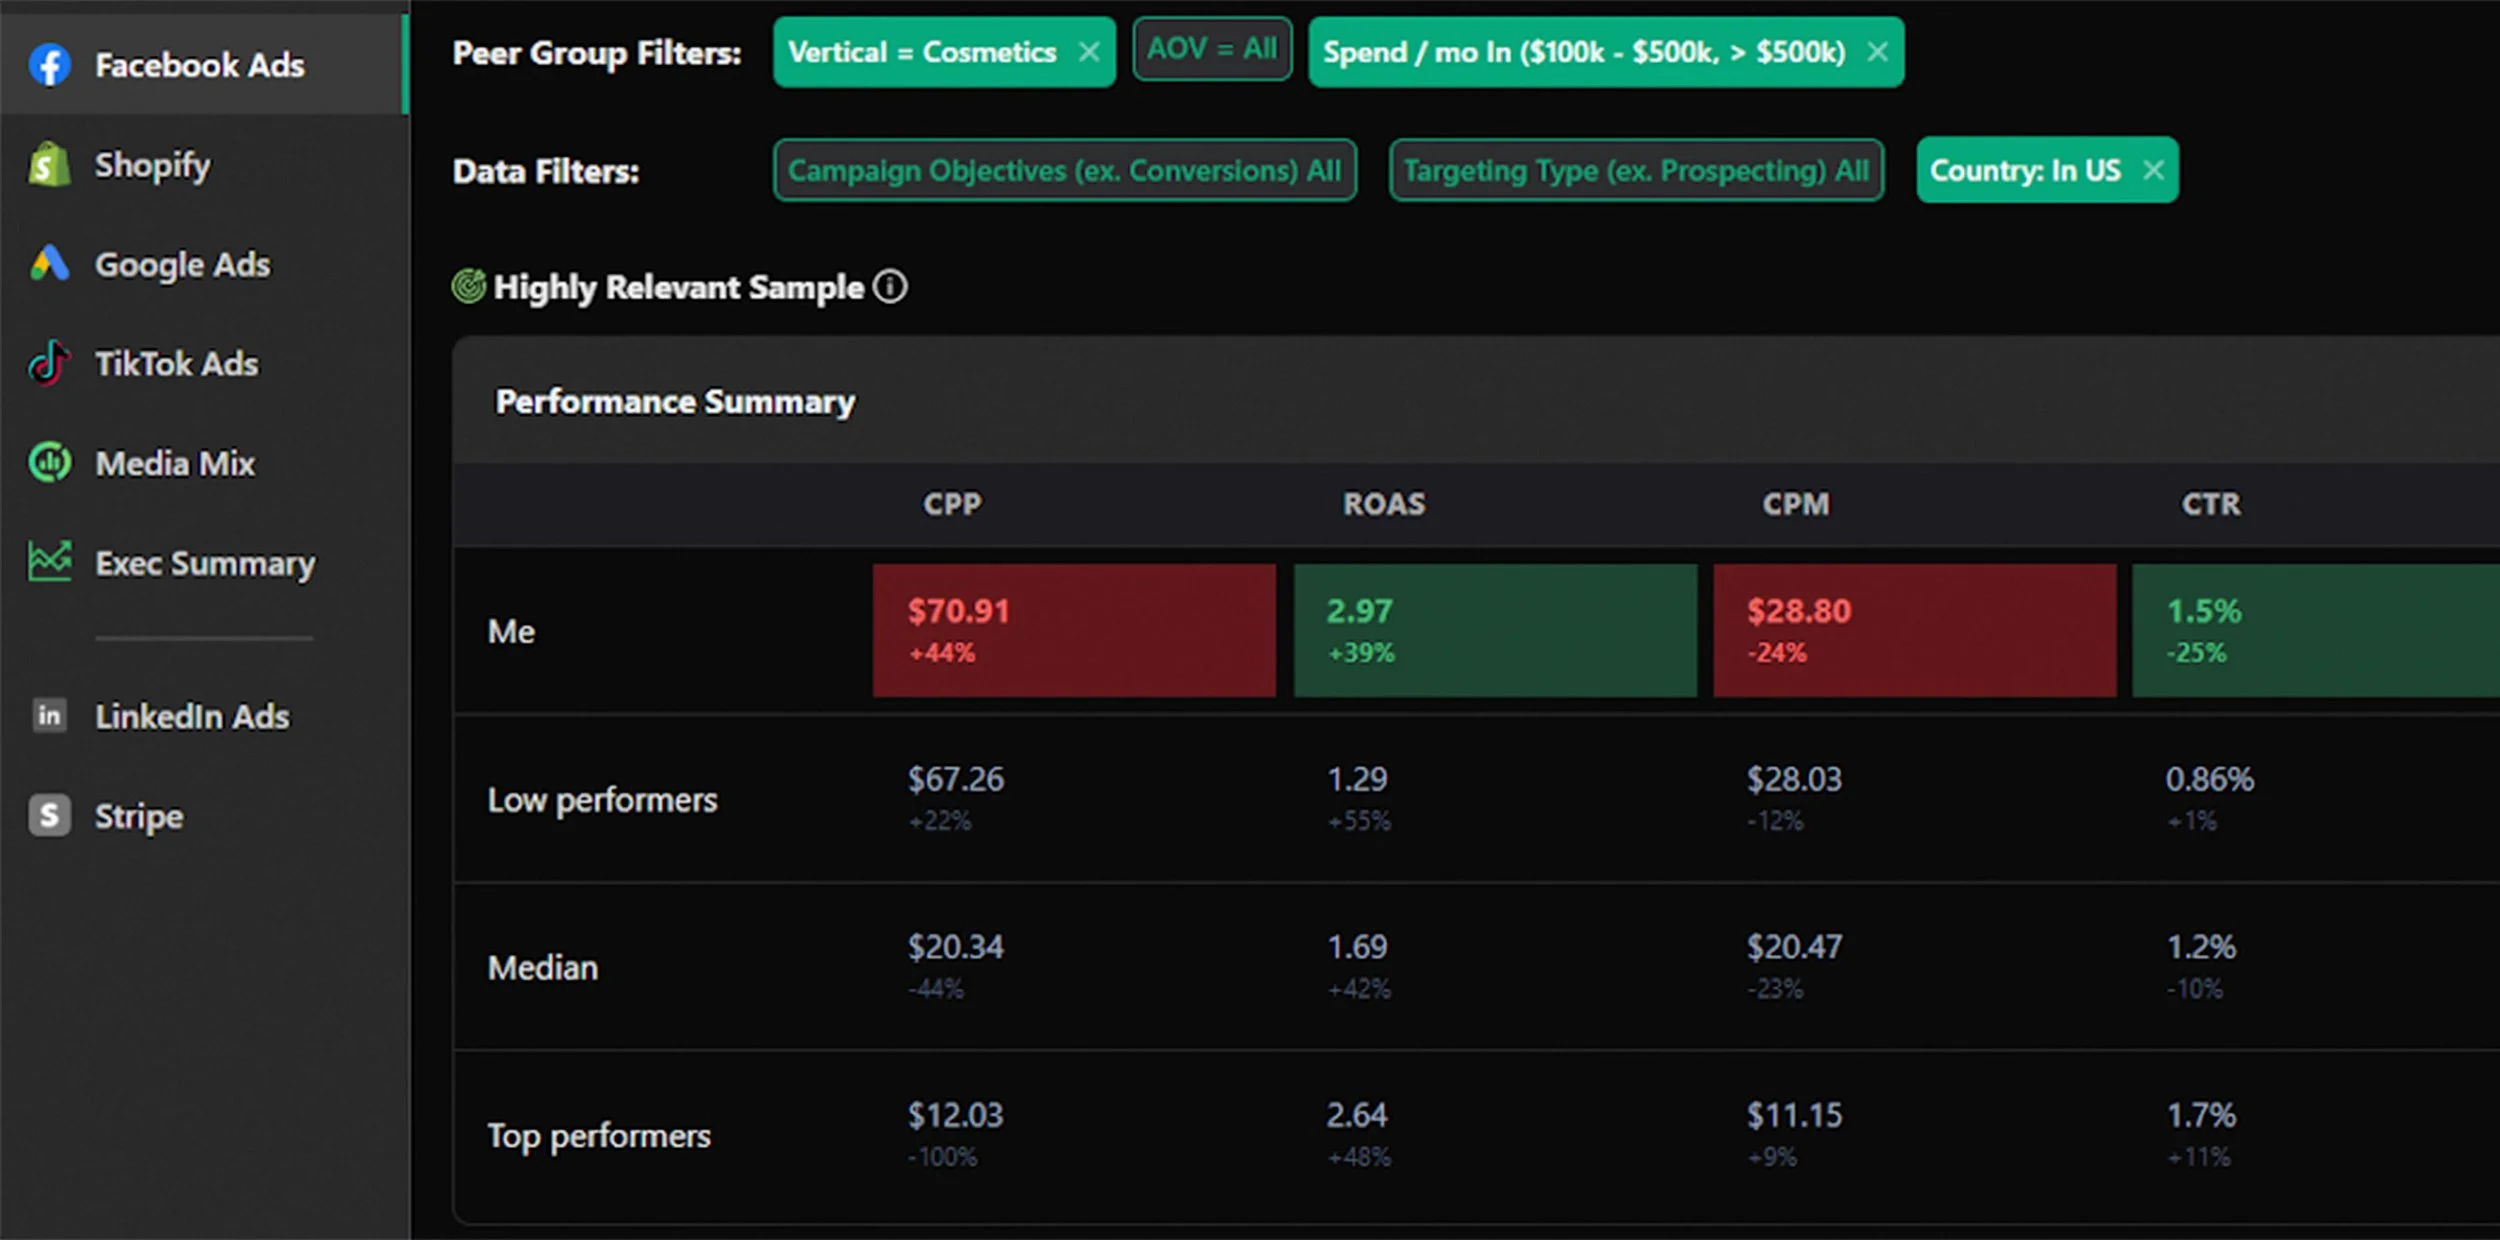
Enhanced peer group controls with deeper categories (Men's vs Women's fashion), AOV & monthly spend filters, and sample quality indicators
Implemented "Metric Focus" (formerly "Anchoring") on individual charts with clear UI indicators
Added summary panels showing benchmark averages
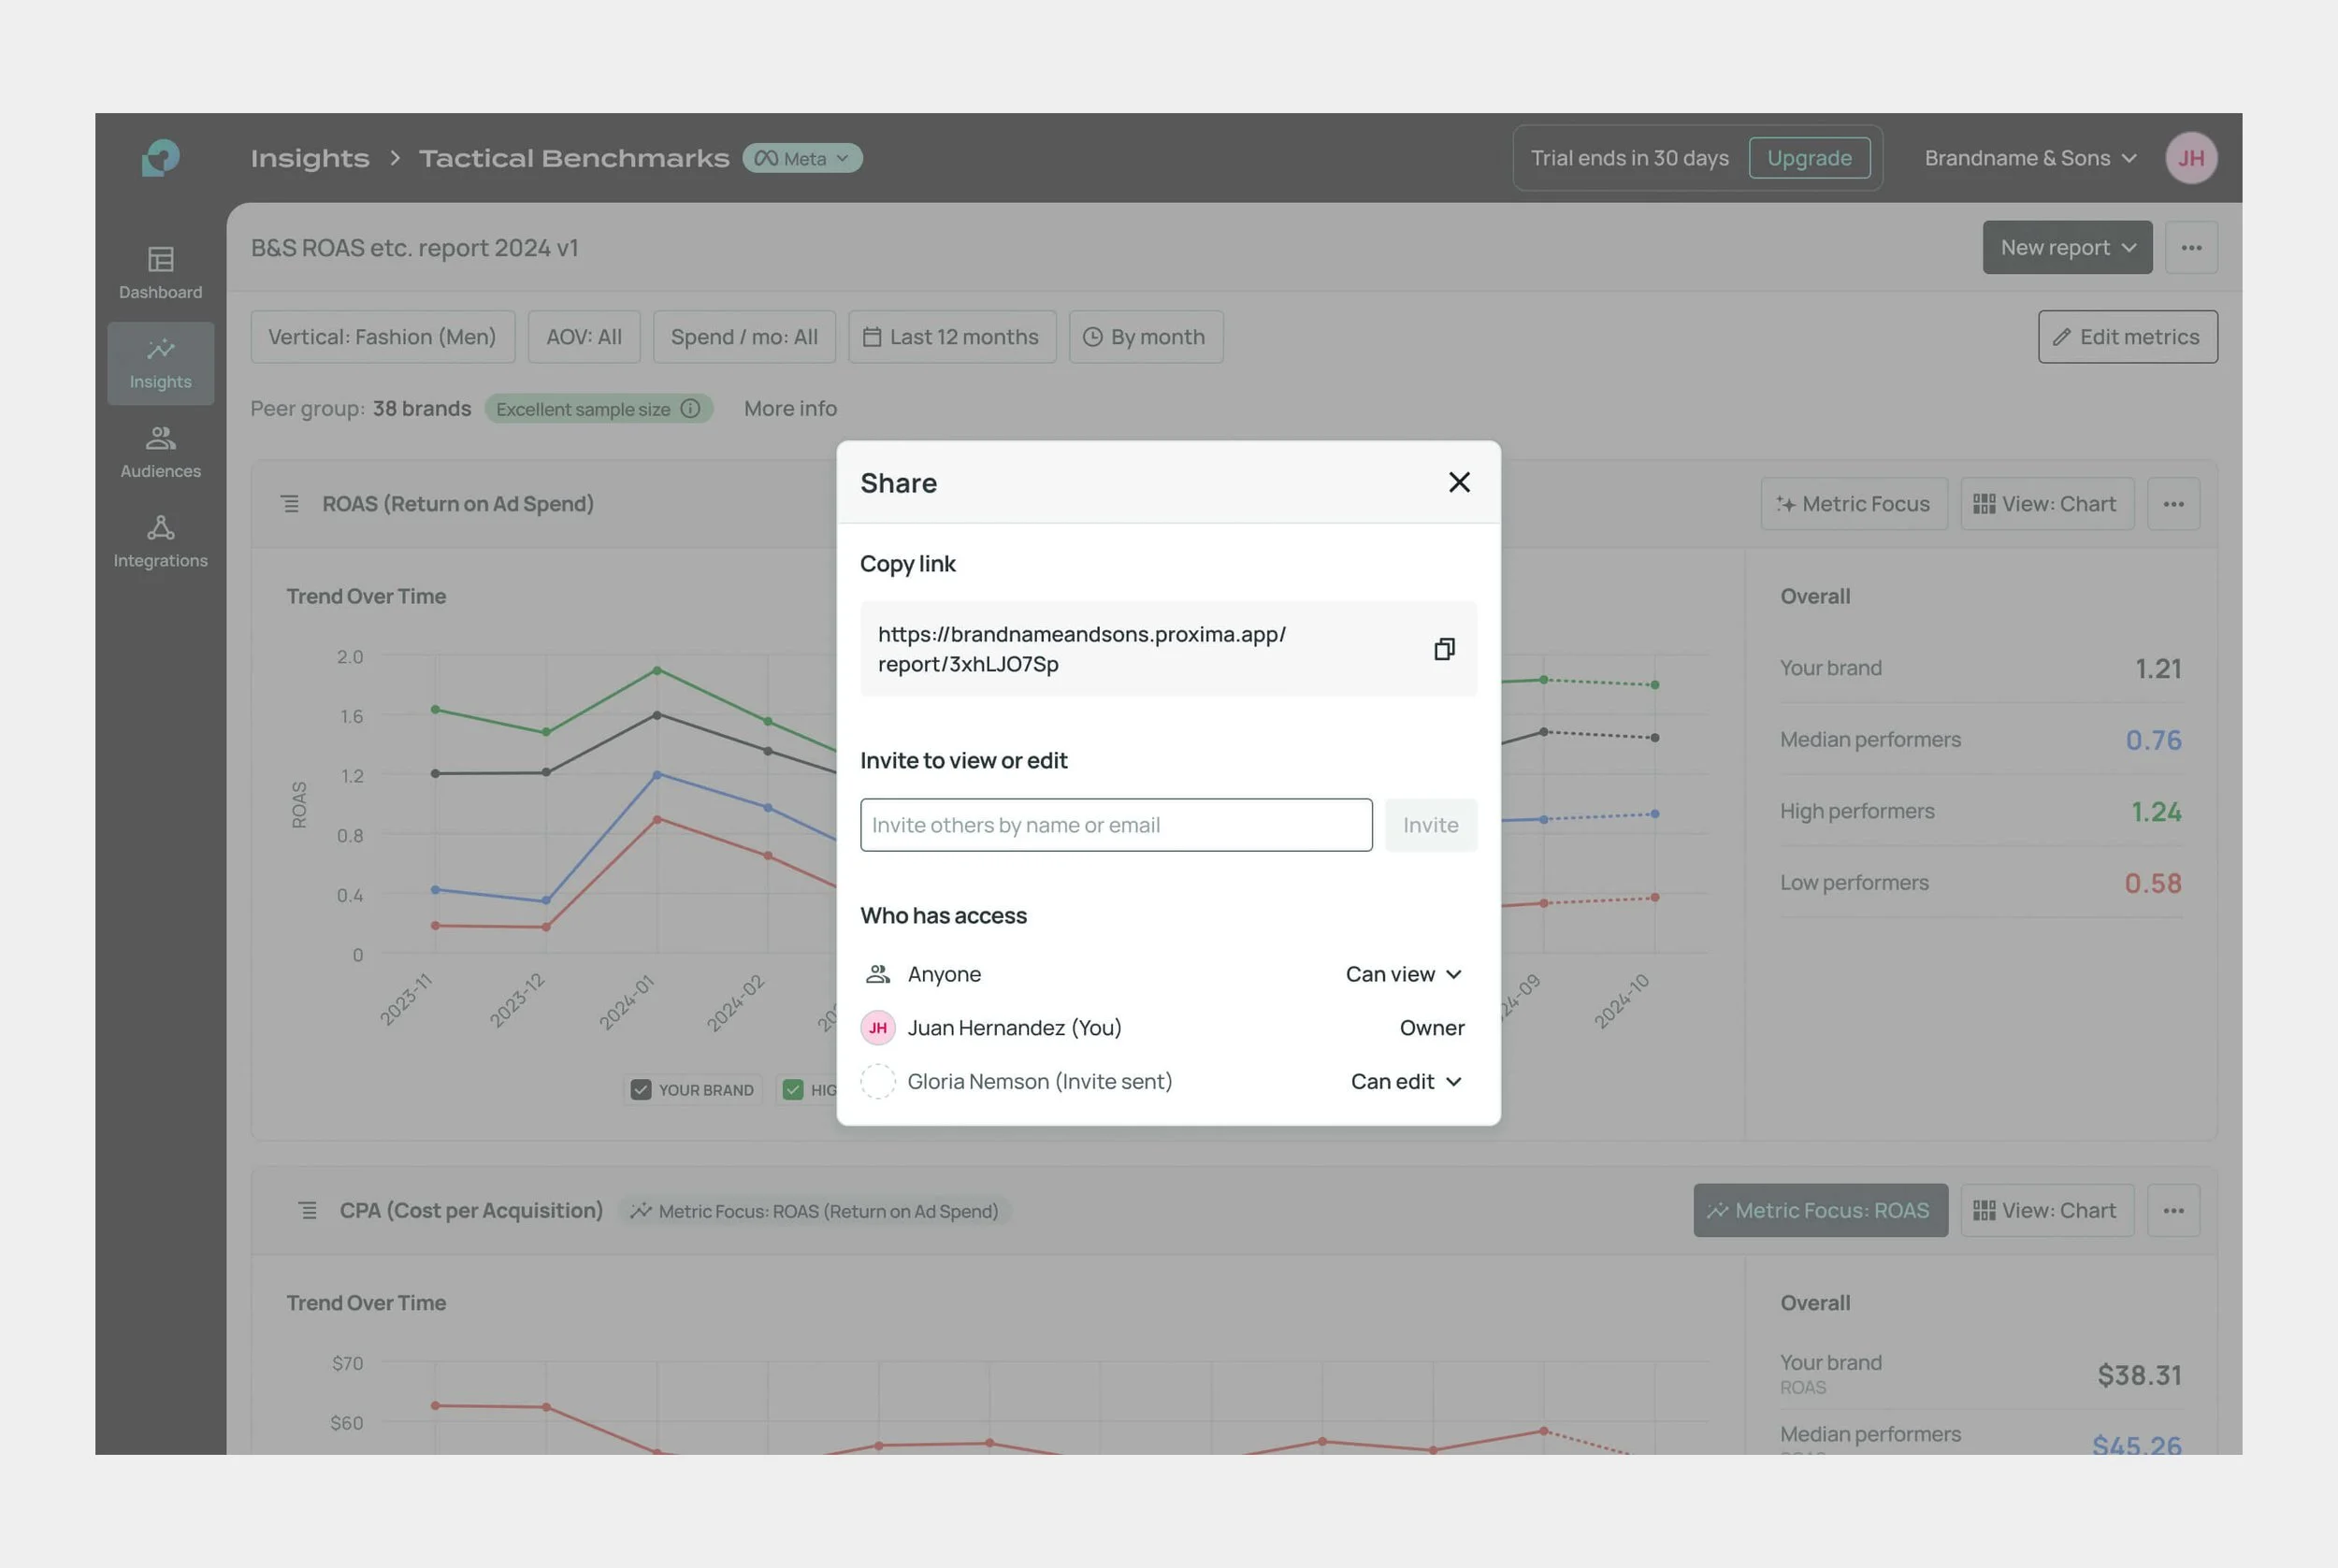
Included sharing and export functionality at both report and chart levels
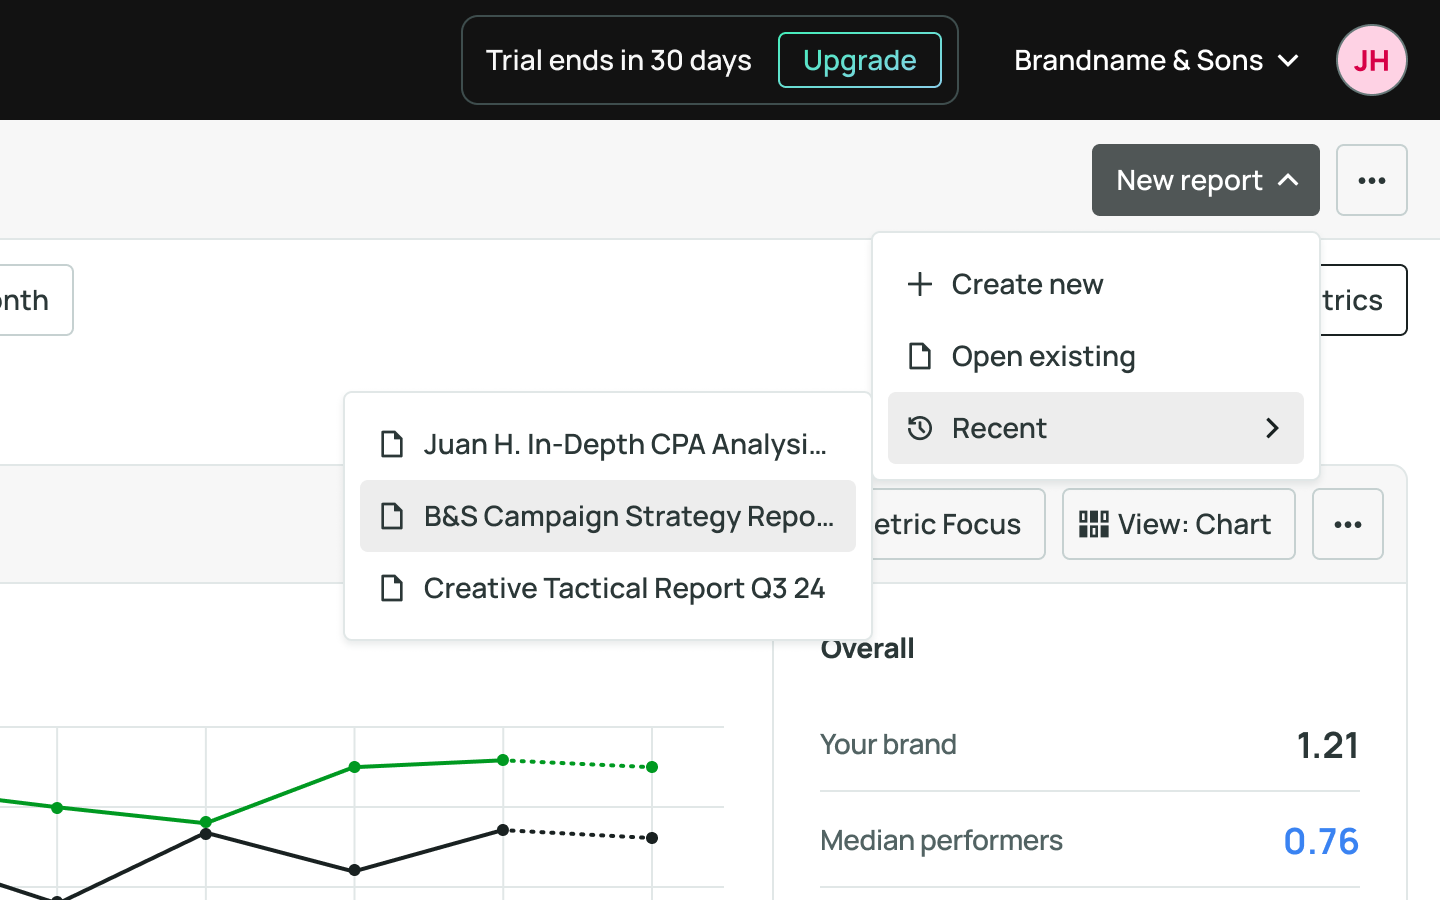
Created ability to build, save, and load multiple reports

Conclusion
Results
With Tactical Benchmarks and Performance Trends, we saw a 50% improvement in data retention, Proxima’s primary KPI.
Feature impact:
40% more Meta integrations and 10% more Shopify integrations.
24% longer session length for Insights users, 78% increase in repeat visitors.
64% conversion rate with new users in the first 30 days.
Curated a Beta group with 14 engaged power users.
Takeaways
The launch of these tools was a milestone, providing clearer performance insights and shaping Proxima’s roadmap toward creative strategy analytics.
Key takeaways:
Shifted Proxima toward a product-led model, reducing reliance on contract marketing services.
Leveraged foundational design and backend work for faster scaling.
Introduced a new design system, improving design-dev workflows.
Built reusable UI components and a scalable data visualization system for future insights tools.